
Introduction to Intake
Overview
Intake is a python library that provides a consistent interface for accessing data regardless of where or how it is stored. In this notebook you will learn to:
Interact with Intake catalogs
Use Intake to access data stored in the cloud
Use Intake to load data into Dask
Prerequisites
Concepts |
Importance |
Notes |
|---|---|---|
Necessary |
||
Necessary |
||
Helpful |
||
Helpful |
||
Helpful |
Time to learn: 45 minutes
Imports
import intake
import xarray as xr
import datetime as dt
import metpy
import matplotlib.pyplot as plt
import cartopy.crs as ccrs
import requests
import aiohttp
import intake_xarray
Interacting with Intake Catalogs
Intake uses an object called a catalog to inform users what datasets are available to them. These catalogs can be in the form of a yaml file, a server, or a python package you install. In this example we will use a catalog to access Mesowest’s HRRR data stored on AWS S3. To open a catalog use Intake’s open_catalog method with the location of the catalog as an argument. The catalog object created by calling open_catalog is iterable, so you can see what data sources are available to you by passing your catalog object as an argument to python’s list function. You can view the catalog file used for this cookbook on Github.
cat = intake.open_catalog('catalog.yml')
list(cat)
['data_dictionary', 'hrrrzarr', 'readme']
Each of the catalog’s sources are accessible as properties of your catalog object.
cat.hrrrzarr
hrrrzarr:
  args:
    chunks: null
    consolidated: true
    storage_options:
      anon: true
    urlpath:
    - s3://hrrrzarr/sfc/20160824/20160824_00z_anl.zarr/surface/TMP
    - s3://hrrrzarr/sfc/20160824/20160824_00z_anl.zarr/surface/TMP/surface
  description: Mesowest's HRRR data. See readme source for more information.
  driver: intake_xarray.xzarr.ZarrSource
  metadata:
    catalog_dir: /home/runner/work/intake-cookbook/intake-cookbook/notebooks/
    coords: !!python/tuple
    - projection_x_coordinate
    - projection_y_coordinate
    dims:
      projection_x_coordinate: 1799
      projection_y_coordinate: 1059
Learning About Catalog Entries
The first place you can look for information about a catalog source is it’s description. That is stored in the data sources’s description property.
cat.hrrrzarr.description
"Mesowest's HRRR data. See readme source for more information."
To get a better look at a source in a Intake catalog, call it’s describe method
desc = cat.hrrrzarr.describe()
desc
{'name': 'hrrrzarr',
 'container': 'xarray',
 'plugin': ['zarr'],
 'driver': ['zarr'],
 'description': "Mesowest's HRRR data. See readme source for more information.",
 'direct_access': 'forbid',
 'user_parameters': [{'name': 'date',
   'description': 'Date and hour of data.',
   'type': 'datetime',
   'min': Timestamp('2016-08-24 00:00:00'),
   'default': Timestamp('2016-08-24 00:00:00')},
  {'name': 'level',
   'description': "Parameter specifying level in the atmosphere. Corresponds to 'Vertical Level' column in data_dictionary",
   'type': 'str',
   'default': 'surface'},
  {'name': 'param',
   'description': "Specifies what parameter your dataset will contain. Corresponds to 'Parameter Short Name' in data_dictionary",
   'type': 'str',
   'default': 'TMP'}],
 'metadata': {'coords': ('projection_x_coordinate', 'projection_y_coordinate'),
  'dims': {'projection_x_coordinate': 1799, 'projection_y_coordinate': 1059}},
 'args': {'chunks': None,
  'consolidated': True,
  'storage_options': {'anon': True},
  'urlpath': ["s3://hrrrzarr/sfc/{{date.strftime('%Y%m%d/%Y%m%d_%Hz_anl.zarr')}}/{{level}}/{{param}}",
   "s3://hrrrzarr/sfc/{{date.strftime('%Y%m%d/%Y%m%d_%Hz_anl.zarr')}}/{{level}}/{{param}}/{{level}}"]}}
From this Python dictionary, there are a few things that we can learn. The container key tells us what form the data will be in when we read it. In this case it will be a Xarray Dataset The user_parameters key has a list containing parameters a user can set to control what data they get. The metadata key contains an arbitrary dictionary of information specified by the catalog author. A common things to find in the metadata field are plots you can use to get a quick peak at the data.
Reading Data with Intake
Now that we know how to explore Intake catalogs, let’s use one to get some data. Luckily Intake makes this a really easy one-liner.
cat.hrrrzarr.read()
/home/runner/miniconda3/envs/intake-cookbook-dev/lib/python3.12/site-packages/intake_xarray/base.py:21: FutureWarning: The return type of `Dataset.dims` will be changed to return a set of dimension names in future, in order to be more consistent with `DataArray.dims`. To access a mapping from dimension names to lengths, please use `Dataset.sizes`.
  'dims': dict(self._ds.dims),
<xarray.Dataset> Size: 4MB
Dimensions:                  (projection_y_coordinate: 1059,
                              projection_x_coordinate: 1799)
Coordinates:
  * projection_x_coordinate  (projection_x_coordinate) float64 14kB -2.698e+0...
  * projection_y_coordinate  (projection_y_coordinate) float64 8kB -1.587e+06...
Data variables:
    TMP                      (projection_y_coordinate, projection_x_coordinate) float16 4MB ...
    forecast_period          timedelta64[ns] 8B 00:00:00
    forecast_reference_time  datetime64[ns] 8B 2016-08-24
    height                   float64 8B 1e+03
    pressure                 float64 8B 2.5e+04
time datetime64[ns] 8B 2016-08-24Info
Intake catalogs access data lazily. You can explore that catalog all you want, but you won’t have any data until use call the read or simillar methods. The read method may take longer to run depending on your internet connection, the size of the data, and your proximity to the data center where the data is stored.
When we look at the description of the hrrrzarr source it referenced the readme source. We can look at it using the same method. Pay attention to the projection information. It will be useful later.
cat.readme.read()
README
Intake Demo Readme
This repository was made as a educational resource to learn the Python library Intake. It contains an intake catalog pointing to Mesowest's High-Resolution Rapid Refresh (HRRR) Zarr data.
Dependencies
- requests
- aiohttp
- intake
- s3fs
- Intake-xarray
- Intake-markdown
- cartopy
About the Data
High-Resolution Rapid Refresh (HRRR) is a atmospheric model maintained by NOAA. As stated on NOAA's website
The HRRR is a NOAA real-time 3-km resolution, hourly updated, cloud-resolving, convection-allowing atmospheric model, initialized by 3km grids with 3km radar assimilation. Radar data is assimilated in the HRRR every 15 min over a 1-h period adding further detail to that provided by the hourly data assimilation from the 13km radar-enhanced Rapid Refresh.
In this cookbook we use a subset of HRRR data maintained by Mesowest on AWS S3 object storage.
HRRR Projection
From Mesowest's HRRR Zarr Data Loading Guide
The projection description for the spatial grid, which is stored in the HRRR grib2 files, is not available directly in the zarr arrays. Additionally, the zarr data has the x and y coordinates in the native Lambert Conformal Conic projection, but not the latitude and longitude data. The various use cases will have more specific examples of how to handle this information, but here we'll note that: The proj params you need to define the grid correctly are: {'a': 6371229, 'b': 6371229, 'proj': 'lcc', 'lon_0': 262.5, 'lat_0': 38.5, 'lat_1': 38.5, 'lat_2': 38.5} We also offer a "chunk index" that has the latitude and longitude coordinates for the grid, more on that under Use Case 3. The following code sets up the correct CRS in cartopy:
projection = ccrs.LambertConformal(central_longitude=262.5,
                                   central_latitude=38.5,
                                   standard_parallels=(38.5, 38.5),
                                    globe=ccrs.Globe(semimajor_axis=6371229,
                                                     semiminor_axis=6371229))
Data Dictionary
This catalog contains a csv source called data_dictionary that describes the data in the the hrrrzarr source. The Vertical Level and Parameter Short Name column are arguments that can be passed to the hrrrzarr source's level and param user parameters respectively.
Usage Example
import intake
import datetime as dt
user_parameters = {'level': 'top_of_atmosphere',
                   'param': 'USWRF',
                   'date': dt.datetime(2021, 4, 25, 6)}

cat = intake.open_catalog('https://raw.githubusercontent.com/jnmorley/intake_demo/main/catalog.yml')

ds = cat.hrrrzarr(**user_parameters).read()
Combining a Days Worth of Data
import intake
import cartopy.crs as ccrs
import datetime as dt
import xarray as xr

cat = intake.open_catalog('https://raw.githubusercontent.com/jnmorley/intake_demo/main/catalog.yml')

projection = ccrs.LambertConformal(central_longitude=262.5,
                                   central_latitude=38.5,
                                   standard_parallels=(38.5, 38.5),
                                    globe=ccrs.Globe(semimajor_axis=6371229,
                                                     semiminor_axis=6371229))
date = dt.datetime(2019, 8, 9)
hours = [date + dt.timedelta(hours=i) for i in range(4)]
datasets = [cat.hrrrzarr(date=hour).read().set_coords("time") for hour in hours]
ds = xr.concat(datasets, dim='time', combine_attrs="drop_conflicts")
End of README
Specifying User Parameters
The hrrrzarr sources in this catalog has three parameters that can be used to control what data you will read in. To list those use the user_parameters key on the description dictionary created above.
desc['user_parameters']
[{'name': 'date',
  'description': 'Date and hour of data.',
  'type': 'datetime',
  'min': Timestamp('2016-08-24 00:00:00'),
  'default': Timestamp('2016-08-24 00:00:00')},
 {'name': 'level',
  'description': "Parameter specifying level in the atmosphere. Corresponds to 'Vertical Level' column in data_dictionary",
  'type': 'str',
  'default': 'surface'},
 {'name': 'param',
  'description': "Specifies what parameter your dataset will contain. Corresponds to 'Parameter Short Name' in data_dictionary",
  'type': 'str',
  'default': 'TMP'}]
Each user parameter can have a name, description, type, defualt, allowed, min, and max key. You can learn more about parameter definitions in Intake’s documentation. This data source contains three user parameters: date, level, and param. Each parameter’s descriptions explain what they are for. The level and param parameter allow you to select data based on level in the atmosphere and variable being measured. There allowed values correspond to values in the “Vertical Level” and “Parameter Short Name” column in the data_dictionary source repectively. The date parameter allows you to select data by date.
data_dictionary = cat.data_dictionary.read()
data_dictionary.query("`Vertical Level` == 'surface'")[:10]
| Parameter Long Name | Vertical Level | Parameter Short Name | Units | 1st Version Available | Analysis or Forcast | Notes | |
|---|---|---|---|---|---|---|---|
| 133 | Visibility | surface | VIS | m | V3 | both | |
| 134 | Wind Gust | surface | GUST | m/s | V3 | both | |
| 135 | Hail | surface | HAIL_max_fcst | m | V4 | anl | |
| 136 | Hail | surface | HAIL_1hr_max_fcst | m | V4 | fcst | |
| 137 | Pressure | surface | PRES | Pa | V3 | both | |
| 138 | Geopotential Height | surface | HGT | gpm | V3 | both | |
| 139 | Temperature | surface | TMP | K | V3 | both | |
| 140 | Total Snowfall | surface | ASNOW_acc_fcst | m | V3 | both | |
| 141 | Total Snowfall | surface | ASNOW_1hr_acc_fcst | m | V3 | fcst | |
| 142 | Plant Canopy Surface Water | surface | CNWAT | kg/m2 | V3 | both |
Lets use parameters to select surface temperature data from June 20, 2021. We can provide these parameter by passing keyword arguments to the data source.
summer_solstice_2021 = dt.datetime(2021, 6, 20)
source = cat.hrrrzarr(date=summer_solstice_2021, level='surface', param='TMP')
source.read()
/home/runner/miniconda3/envs/intake-cookbook-dev/lib/python3.12/site-packages/intake_xarray/base.py:21: FutureWarning: The return type of `Dataset.dims` will be changed to return a set of dimension names in future, in order to be more consistent with `DataArray.dims`. To access a mapping from dimension names to lengths, please use `Dataset.sizes`.
  'dims': dict(self._ds.dims),
<xarray.Dataset> Size: 4MB
Dimensions:                  (projection_y_coordinate: 1059,
                              projection_x_coordinate: 1799)
Coordinates:
  * projection_x_coordinate  (projection_x_coordinate) float64 14kB -2.698e+0...
  * projection_y_coordinate  (projection_y_coordinate) float64 8kB -1.587e+06...
Data variables:
    TMP                      (projection_y_coordinate, projection_x_coordinate) float16 4MB ...
    forecast_period          timedelta64[ns] 8B 00:00:00
    forecast_reference_time  datetime64[ns] 8B 2021-06-20
    height                   float64 8B 1e+03
    pressure                 float64 8B 2.5e+04
time datetime64[ns] 8B 2021-06-20Your data source now points to surface temperature data taken June 20, 2021
A More Complicated Example
Mesowest provides a tutorial for reading a days worth of surface temperature HRRR data from AWS. Lets see what the same task looks like using Intake.
We will start by setting up our Cartopy projection according to the information given in the readme source.
projection = ccrs.LambertConformal(central_longitude=262.5,
                                   central_latitude=38.5,
                                   standard_parallels=(38.5, 38.5),
                                    globe=ccrs.Globe(semimajor_axis=6371229,
                                                     semiminor_axis=6371229))
Now lets read in the data with Intake. To do this will create a datetime object with the date August 9, 2019. Then we will use list comprehension and timedelta objects to create a datetime object for each hour that day. Again, using list comprehension, we will create a list of datasets using Intake. In order to concatenate our list of datasets using Xarray, we need a dimension to concatenate accross. Each dataset in our list contains a time variable with an array of just one timestamp. We can promote that variable to a coordinate using the set_coords method. This may take a few minutes to run.
%%time
date = dt.datetime(2019, 8, 10)
hours = [date + dt.timedelta(hours=i) for i in range(24)]
datasets = [cat.hrrrzarr(date=hour).read().set_coords("time") for hour in hours]
ds = xr.concat(datasets, dim='time', combine_attrs="drop_conflicts")
ds
/home/runner/miniconda3/envs/intake-cookbook-dev/lib/python3.12/site-packages/intake_xarray/base.py:21: FutureWarning: The return type of `Dataset.dims` will be changed to return a set of dimension names in future, in order to be more consistent with `DataArray.dims`. To access a mapping from dimension names to lengths, please use `Dataset.sizes`.
  'dims': dict(self._ds.dims),
CPU times: user 5.58 s, sys: 393 ms, total: 5.98 s
Wall time: 1min 31s
<xarray.Dataset> Size: 91MB
Dimensions:                  (time: 24, projection_y_coordinate: 1059,
                              projection_x_coordinate: 1799)
Coordinates:
  * projection_x_coordinate  (projection_x_coordinate) float64 14kB -2.698e+0...
  * projection_y_coordinate  (projection_y_coordinate) float64 8kB -1.587e+06...
  * time                     (time) datetime64[ns] 192B 2019-08-10 ... 2019-0...
Data variables:
    TMP                      (time, projection_y_coordinate, projection_x_coordinate) float16 91MB ...
    forecast_period          (time) timedelta64[ns] 192B 00:00:00 ... 00:00:00
    forecast_reference_time  (time) datetime64[ns] 192B 2019-08-10 ... 2019-0...
    height                   (time) float64 192B 1e+03 1e+03 ... 1e+03 1e+03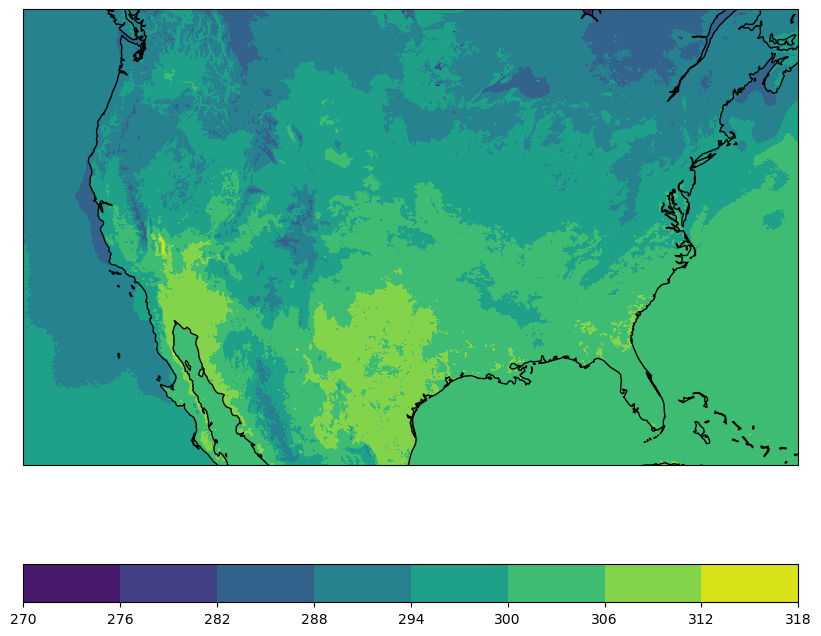
pressure (time) float64 192B 2.5e+04 2.5e+04 ... 2.5e+04Now our data is ready to be analyzed in the normal way using Xarray.
avg_TMP = ds.TMP.mean(dim='time')
fig = plt.figure(figsize=(10, 8.5))
ax = fig.add_subplot(1, 1, 1, projection=projection)
temp_plot = ax.contourf(avg_TMP.projection_x_coordinate, avg_TMP.projection_y_coordinate, avg_TMP)
ax.coastlines()
fig.colorbar(temp_plot, orientation="horizontal")

plt.show()
/home/runner/miniconda3/envs/intake-cookbook-dev/lib/python3.12/site-packages/cartopy/io/__init__.py:241: DownloadWarning: Downloading: https://naturalearth.s3.amazonaws.com/50m_physical/ne_50m_coastline.zip
  warnings.warn(f'Downloading: {url}', DownloadWarning)
Using Intake with Dask
Often times the data we want to analyze is too big to be loaded into memory all at once on your computer. Dask solves this problem by breaking up your data into smaller chunks, operating on each chunck of data, and then aggregating the results. This is usually done in parallel on a cluster system. You can use Intake to create a Dask dataset by using the to_dask method instead of the read method.
ds1 = cat.hrrrzarr(date=dt.datetime(2021, 1, 1)).read()
print(type(ds1.TMP.data))

ds2 = cat.hrrrzarr(date=dt.datetime(2022, 1, 1)).to_dask()
print(type(ds2.TMP.data))
/home/runner/miniconda3/envs/intake-cookbook-dev/lib/python3.12/site-packages/intake_xarray/base.py:21: FutureWarning: The return type of `Dataset.dims` will be changed to return a set of dimension names in future, in order to be more consistent with `DataArray.dims`. To access a mapping from dimension names to lengths, please use `Dataset.sizes`.
  'dims': dict(self._ds.dims),
<class 'numpy.ndarray'>
<class 'dask.array.core.Array'>
/home/runner/miniconda3/envs/intake-cookbook-dev/lib/python3.12/site-packages/intake_xarray/base.py:21: FutureWarning: The return type of `Dataset.dims` will be changed to return a set of dimension names in future, in order to be more consistent with `DataArray.dims`. To access a mapping from dimension names to lengths, please use `Dataset.sizes`.
  'dims': dict(self._ds.dims),
As you can see Xarray uses Dask arrays instead of NumPy arrays to hold the data when the to_dask method is used.
Summary
Intake makes it easy to consistently access data regardless of where and how it is stored
Intake catalogs contain useful information about the data they make available
Intake can load data into Dask for use in parallel computing.
What’s next?
In the next notebook we will look at writing a Intake catalog and making it available on Github.