import intake
import uxarray as ux
import cartopy.crs as ccrs
import healpy
import cmocean
import matplotlib.pyplot as plt
import easygems.healpix as egh
import cartopy.feature as cf
import time
Loading...
cat_url = "https://digital-earths-global-hackathon.github.io/catalog/catalog.yaml"
cat = intake.open_catalog(cat_url)['NCAR']
model_run = cat.wrf_conus%%time
ds= model_run(zoom=10).to_dask()
a=ds['eastward_wind'][:744]
a
Loading...
%%time
ds
Loading...
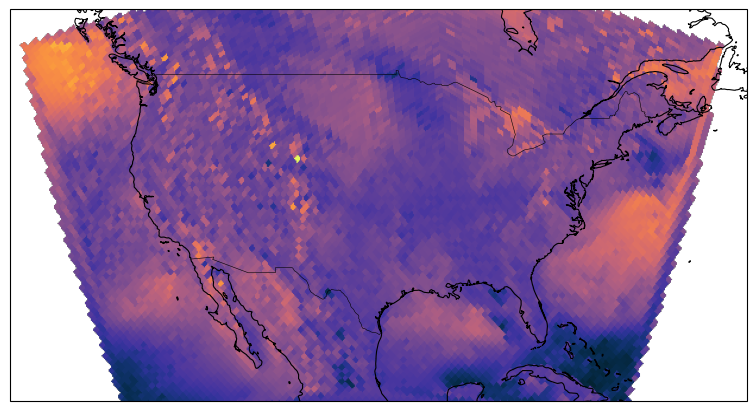
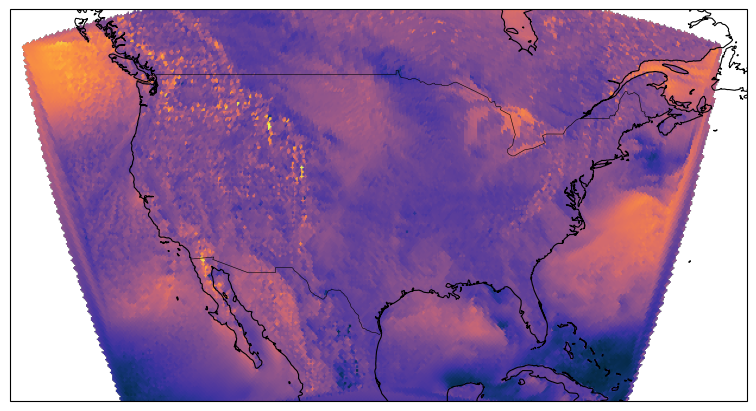
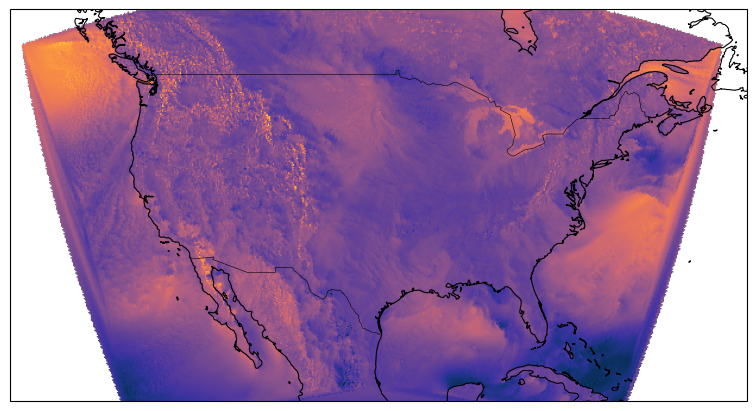
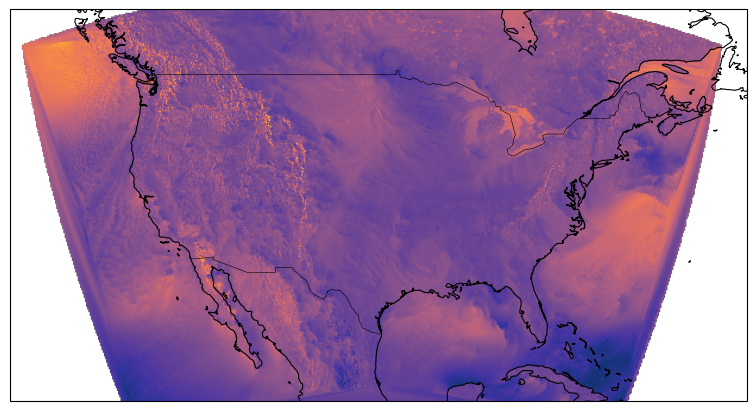
# egh.healpix_show(ds.eastward_wind.isel(Time=0), ax=ax, cmap=cmocean.cm.thermal)zoom_level=[7,8,9,10]
time_zoom=[]
projection = ccrs.Robinson(central_longitude=-100)
for z in zoom_level:
start_time=time.time()
ds= model_run(zoom=z).to_dask()
a=ds['eastward_wind'].cell.values
end_time=time.time()
total_time=end_time-start_time
time_zoom.append(total_time)
fig, ax = plt.subplots(
figsize=(8, 4), subplot_kw={"projection": projection}, constrained_layout=True
)
ax.set_extent([-135, -60, 20, 55], crs=ccrs.PlateCarree())
egh.healpix_show(ds.eastward_wind.isel(Time=0), ax=ax, cmap=cmocean.cm.thermal)
ax.add_feature(cf.COASTLINE, linewidth=0.8)
ax.add_feature(cf.BORDERS, linewidth=0.4)
plt.show()/glade/u/apps/opt/conda/envs/2025-digital-earths-global-hackathon/lib/python3.12/site-packages/intake_xarray/base.py:21: FutureWarning: The return type of `Dataset.dims` will be changed to return a set of dimension names in future, in order to be more consistent with `DataArray.dims`. To access a mapping from dimension names to lengths, please use `Dataset.sizes`.
'dims': dict(self._ds.dims),
/glade/u/apps/opt/conda/envs/2025-digital-earths-global-hackathon/lib/python3.12/site-packages/intake_xarray/base.py:21: FutureWarning: The return type of `Dataset.dims` will be changed to return a set of dimension names in future, in order to be more consistent with `DataArray.dims`. To access a mapping from dimension names to lengths, please use `Dataset.sizes`.
  'dims': dict(self._ds.dims),
plt.plot(zoom_level,time_zoom)
plt.xlabel('Zoom Level')
plt.ylabel('Time in seconds')
plt.title('Time vs Zoom')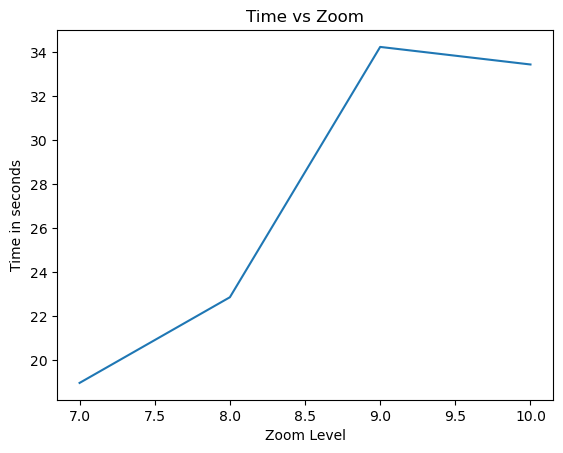
ds.eastward_wind.isel(Time=0)HEALPIX FOR REGIONAL DATA LIKE CONUS DOESN’T WORK (YET)
uxds = ux.UxDataset.from_healpix(ds)
# uxds=uxds.eastward_wind
uxds
uxds2 = uxds.drop_vars("cell")uxds2uxda = uxds.isel(Time=10)uxda.plot()uxds2.isel(Time=10)