Calculate MUCAPE on a grid of netCDF data using MetPy.
## importing all the packages we might need later for our calculation
import metpy.calc as mpcalc
import xarray as xr
import numpy as np
from metpy.calc import cape_cin, surface_based_cape_cin, dewpoint_from_specific_humidity, parcel_profile,relative_humidity_from_specific_humidity,most_unstable_cape_cin, precipitable_water
from metpy.units import units
import matplotlib.pyplot as plt
import cartopy.crs as ccrs
import cartopy.feature as cfeature
## opening NetCDF file using xarray
ds = xr.open_dataset("NETCDF_FILE.nc", decode_times=True)dsLoading...
#### making a function to slice the xarray dataset according to our need.
def slicer (data,lat1, lat2, lon1, lon2, time1,time2) :
    sliced_data = data.sel(lat =slice(lat1, lat2), lon = slice(lon1, lon2),time = slice(time1, time2))
    return sliced_data
#slicing the data for CONUS only
new_data = slicer(ds,23.5,50.5,-125.5,-66.5, ds.time[0], ds.time[0])new_dataLoading...
##extracting temperature, pressure  and specific humidity from the dataset
p =new_data.lev*units('hPa')
T = new_data.T
sh =  new_data.QV*units('dimensionless')


CAPE = np.zeros((1, 28, 60),dtype=float)


###calculating CAPE in multidimension

for h in range (len(new_data.time)):
    for i in range (len(new_data.lat)):
        for j in range(len(new_data.lon)):


            TC = (T[h,:,i,j]-(273.15))*units('degC')
            Td = dewpoint_from_specific_humidity(np.array(p)*units('hPa'),TC, sh[h,:,i,j])
#
            try:
                MUCAPE = most_unstable_cape_cin(np.array(p)*units('hPa'),np.array(TC)*units('degC'), np.array(Td)*units('degC'))
            except:
                pass
            CAPE[h,i,j] = MUCAPE[0].magnitude
dataproj = ccrs. PlateCarree ()
# # Plot projection
# # The look you want for the view.
plotproj = ccrs. PlateCarree ()
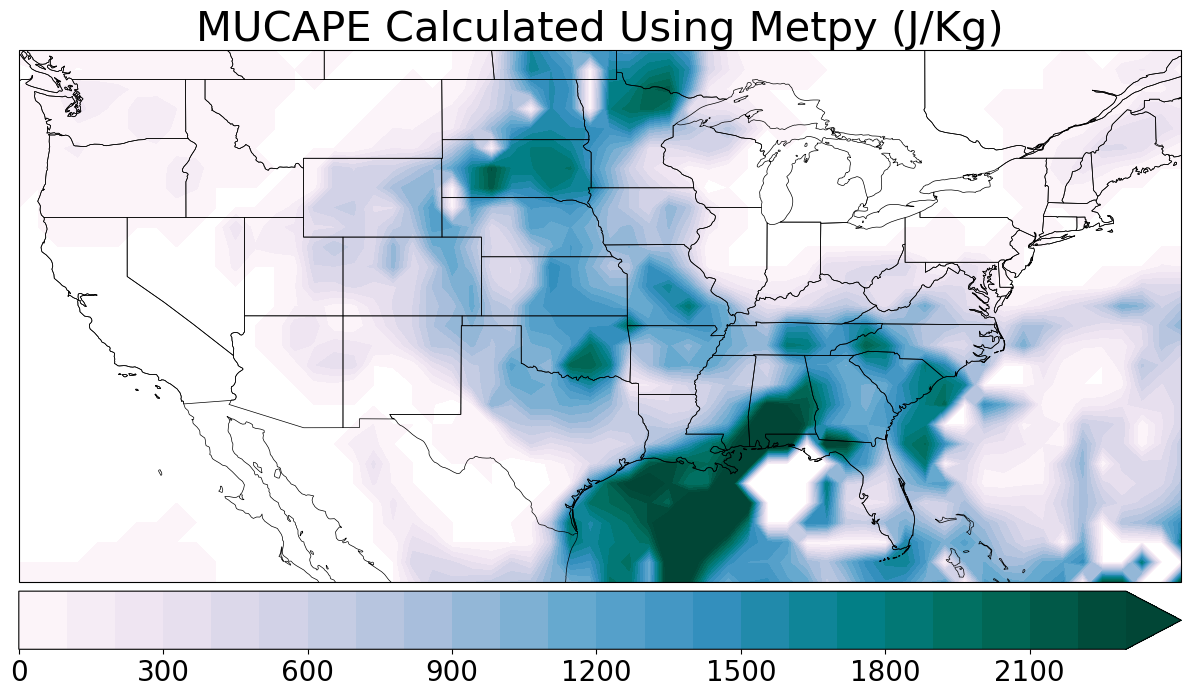
fig=plt.figure(1, figsize=(15.,12.))
ax=plt.subplot(111,projection=plotproj)
ax.add_feature(cfeature.COASTLINE, linewidth=0.5)
ax.add_feature(cfeature.STATES, linewidth=0.5)
plt.title("MUCAPE Calculated Using Metpy (J/Kg)",size = 30)
plt.contourf (new_data.lon, new_data. lat, CAPE[0,:,:],levels =np.arange(0,2400,100),cmap = "PuBuGn", transform=dataproj,extend = "max")
plt.colorbar (orientation = "horizontal", pad=0.01).ax.tick_params(labelsize=20)
plt. show ()