The PyCoGSS software and resource environment make it easier for scientists who study landscapes to document Arctic change using large datasets. We are creating software to search for, identify, and study topographic patterns and change in landscapes underlain by permafrost, step-by-step guides on how to use it, and educational materials to teach the next generation of geoscientists. We focus on the Arctic because while there are now many new datasets of this remote environment, their size and complexity can make them daunting to use for asking science questions. Our goal is to empower undergraduate researchers to collect input data for teaching computers how to find landscape disturbances and to use those data for their own research questions.
Overview
In this notebook you will learn about spectral data and how it can be used to track vegetation change. You will learn why it is important to track vegetation change across the Arctic, and how a scalable and reproducible approach to this problem will answer important questions about changing permafrost landscapes.
Prerequisites
To fully understand the context and content of this notebook, readers should be familiar with a few foundational concepts and tools. While this notebook itself is explanatory and doesn’t run any code, it introduces ideas and data structures that are implemented in the accompanying technical notebook.
Below is a table of key concepts and how important they are for this material:
| Concepts | Importance | Notes |
|---|---|---|
| Intro to STAC: an Overview of the Specification | Necessary | Read about the SpatioTemporal Asset Catalog (STAC) specification |
| What is NDVI? | Helpful | Short page describing NDVI from satellites |
| OSDF and PelicanFS Overview | Necessary | Explains how the curated data is accessed from OSDF through PelicanFS |
Time to learn: 45-60 minutes.
Motivation
What is NDVI?
NDVI (Normalized Difference Vegetation Index) is a simple way to measure how green and healthy vegetation is using satellite imagery. It compares how much red light and near-infrared light (NIR) is reflected from the Earth’s surface:
Healthy vegetation absorbs most of the red light for photosynthesis and reflects a lot of near-infrared light.
Unhealthy or sparse vegetation reflects more red light and less near-infrared light.
NDVI is calculated using the following formula:
Where:
NIR = reflectance in the near-infrared band
RED = reflectance in the red band
How do satellites help track NDVI in the Arctic?
Satellite data can track vegetation change in the Arctic by repeatedly measuring how much red and near-infrared light is reflected from the land surface over time. By comparing NDVI values across seasons and years, scientists can detect trends such as Arctic greening or browning, helping to monitor the effects of climate change on tundra ecosystems at large scales. This is especially important in places like the Arctic, where remote characterization is the rule rather than the exception, and where local effects of climate, fire, and other disturbance can make vegetation change complex.
Why is vegetation changing in the Arctic, and why does it matter?
Vegetation in the Arctic is changing due to climate warming, which enhances plant growth, alters nutrient availability, and shifts species distributions. These changes affect permafrost integrity by modifying soil thermal regimes—vegetation can insulate soils in winter and cool them in summer, influencing thaw depth. These changes promote the growth of shrubs and graminoids, contributing to a trend known as Arctic greening. However, this pattern is not uniform—spatial heterogeneity plays a major role, as local factors like soil moisture, topography, permafrost ice content, and disturbance events (e.g., wildfires, flooding, abrupt thaw) can lead to browning or shifts in plant community composition.The transformation of tundra ecosystems has global implications, including greenhouse gas release from thawing permafrost, contributing to climate feedback loops.
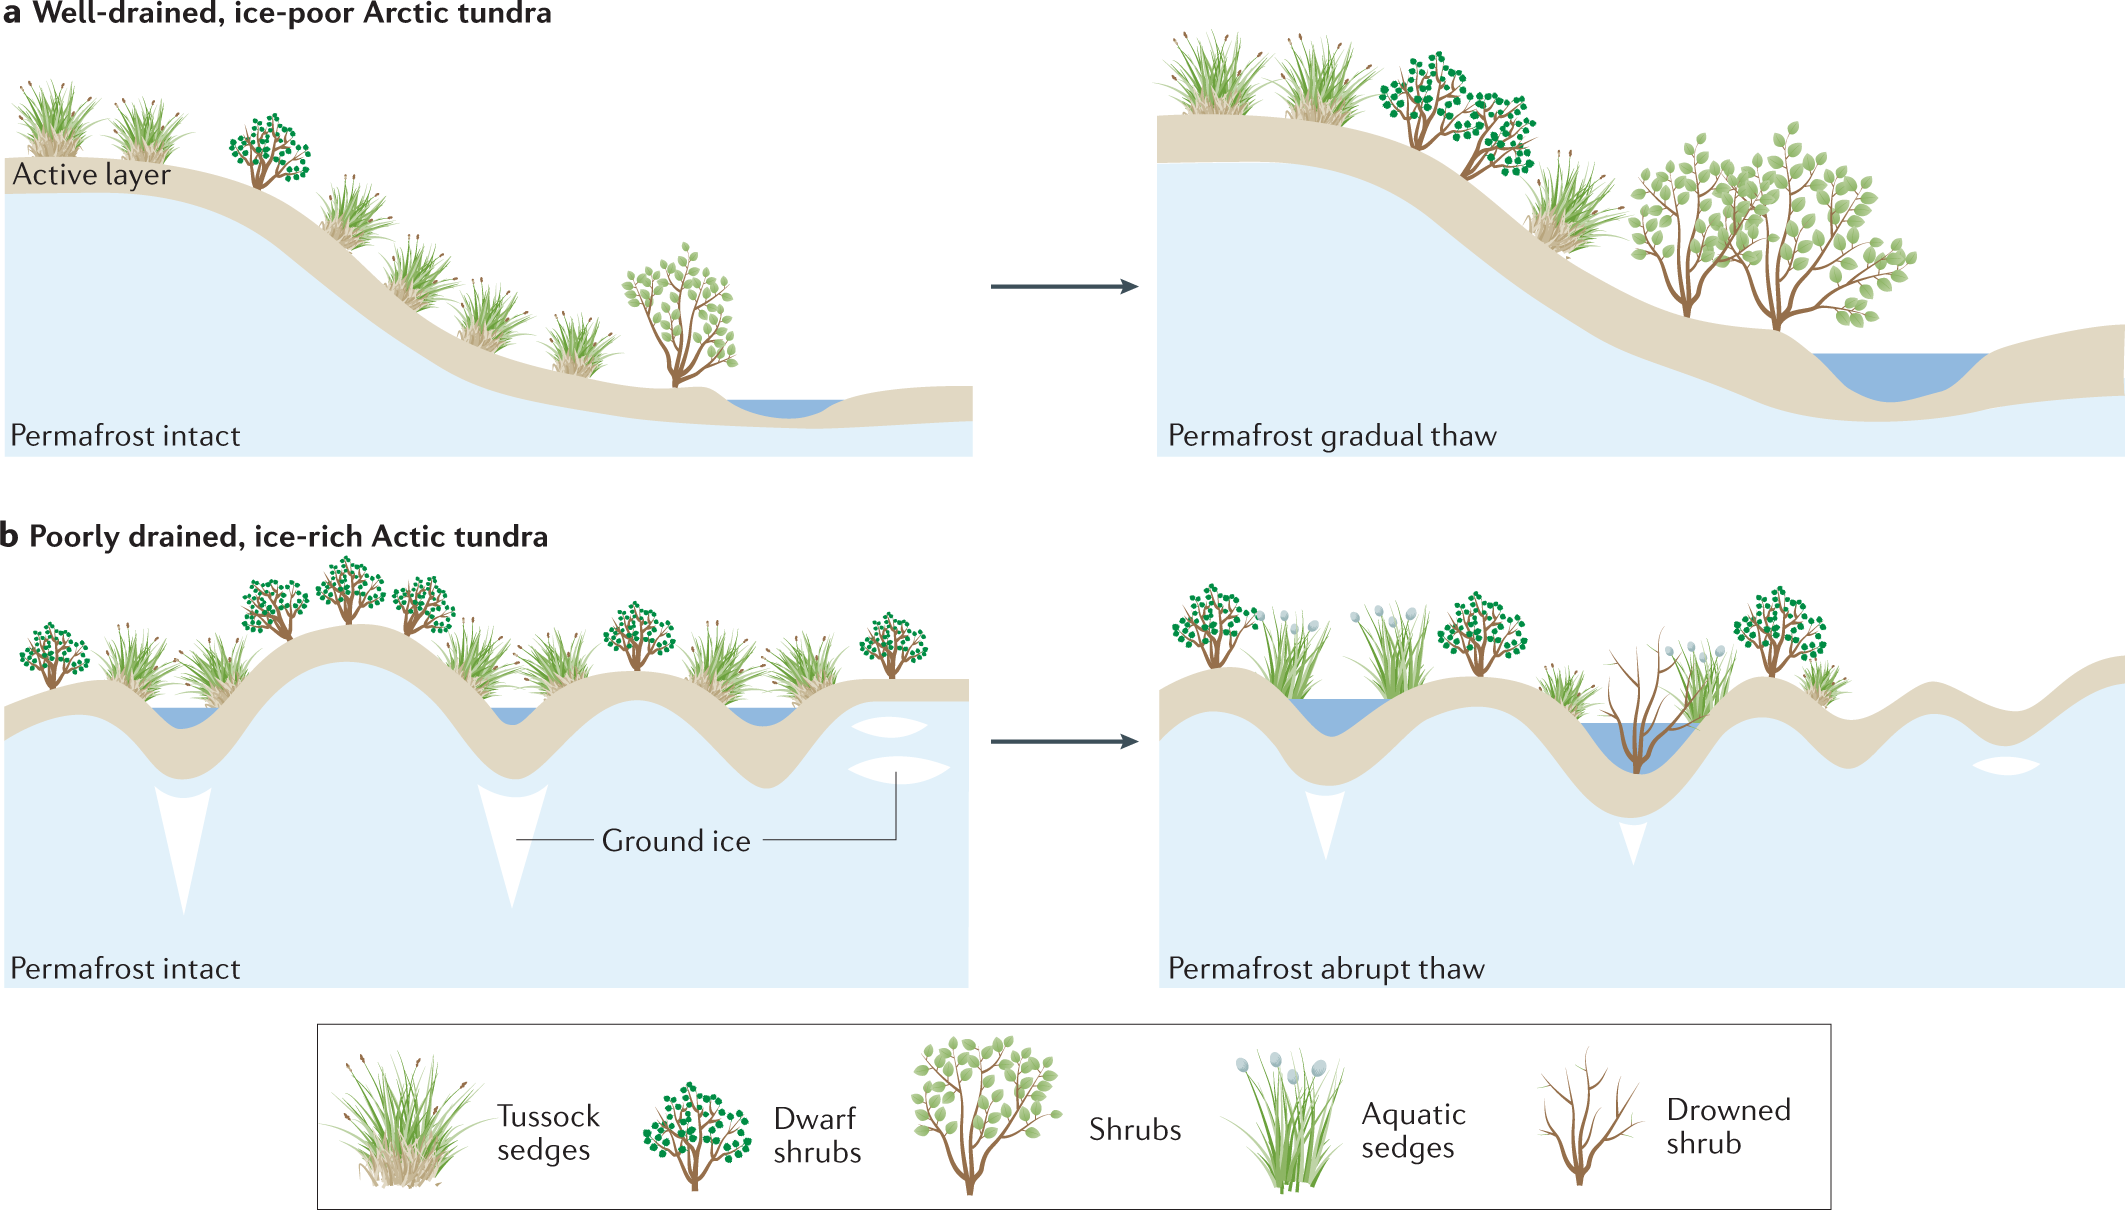
Figure 1 from Heijmans et al., 2022
Research questions
Even though the hydrology and thermal state of permafrost is important in predicting how much it will thaw and the fate of the carbon and sediment subjected to thaw, we generally can’t see water or heat in the subsurface from space. But wouldn’t it be great if we could use vegetation greening and browning to “see” what’s under the permafrost? To get to a place where we can do that, one outstanding research question we would need to solve is how topographic and hydrological variations influence plant growth and change across the Arctic landscape. Our research team is using specific Arctic landforms known as water tracks, which we think are particularly sensitive to climate change, as a sort of “litmus test” for vegetation change to see if these features are getting warmer, colder, wetter, or drier, and how vegetation in versus outisde of these water tracks are changing. That’s why we need a scalable and reproducible workflow to track vegetation change across many temporal scales - tracking green-up (when plants first leaf out and get green early in the growing season) as well as overall greenness (which might go up or down over time depending on climate or landscape change).
Summary
We learned how satellites can track vegetation change, and why it’s particularly useful to use satellites to track vegetation change in the Arctic. We learned why it is important, but perhaps computationally challenging, to develop ways to calculate vegetation change over specific areas over specific times.
What’s Next?
In the next notebook we will:
Establish an area of interest (AOI) in which to track NDVI
For our AOI and time of interest, build a SpatioTemporal Asset Catalog (STAC) of Sentinel-2 L2A data from an AWS archive of the collection.
Search our STAC catalog items in OSDF caches through PelicanFS or default to the AWS archive
Build a lazy spatio-temporal raster dataset of xarray objects from of items in our catalog using OSDF caches or from AWS
Use our spatio-temporal dataset to calculate a time series of NDVI values to monitor spectral characteristics of water tracks in the AOI
- Del Vecchio, J., & Evans, S. G. (2025). Climate and Hydrogeological Controls on Water Tracks in Permafrost Landscapes. Reviews of Geophysics, 63(1). 10.1029/2024rg000854