Estaciones hidrometeorológicas
🧭 Introducción
Las estaciones hidrometeorológicas constituyen la columna vertebral del monitoreo ambiental en Colombia. Este cuadernillo explora cómo acceder, explorar y visualizar la información proveniente de las estaciones del IDEAM (Instituto de Hidrología, Meteorología y Estudios Ambientales), usando Python con las bibliotecas Pandas, Cartopy y Sodapy para acceso a datos abiertos.
Aprenderás a consultar el catálogo nacional de estaciones, visualizar su ubicación geográfica, e integrar consultas de datos históricos y en tiempo casi real desde la plataforma datosabiertos
Introducción a la red de monitoreo del IDEAM
Catálogo de estaciones del IDEAM
Consulta de datos usando la plataforma datosabiertos
.gov .co Consulta de datos de temperatura y precipitación
Otros datos disponibles
❓ ¿Por qué es importante?
El acceso programático a datos hidrometeorológicos permite:
🌊 Gestión de riesgo: Sistemas de alerta temprana para inundaciones
🌾 Agricultura: Optimización de riego basada en pronósticos
🏗️ Infraestructura: Diseño de obras considerando eventos extremos
🔬 Investigación: Análisis de variabilidad y cambio climático
En este cuadernillo desarrollarás las habilidades fundamentales para estos casos de uso.
📚 Descripción general
Al finalizar este cuadernillo, podrás:
Acceder al catálogo nacional de estaciones hidrometeorológicas del IDEAM.
Visualizar estaciones sobre mapas estáticos con Cartopy.
Consultar series de datos históricos de temperatura y precipitación usando
sodapy.Realizar consultas SQL en la API de datos abiertos de Colombia.
Procesar y graficar series de datos recientes en tiempo cercano al real.
✅ Requisitos previos
Conceptos | Importancia | Notas |
|---|---|---|
Necesario | Lectura de datos tabulares | |
Necesario | Entender estampas de tiempo | |
Necesario | Visualización de mapas y proyecciones geográficas |
⏱️ Tiempo estimado de aprendizaje: 30 minutos
✍️ Formato: Interactivo. Ejecuta y modifica el código en cada celda.
Librerías
Importamos las librerías necesarias para este cuaderno.
from datetime import datetime, timedelta

import cartopy.crs as ccrs
import cartopy.feature as feature
import matplotlib.pyplot as plt
import pandas as pd
from sodapy import Socrata
import pandas as pd
1. 🗂️ Catálogo nacional de estaciones del IDEAM
1.1 📄 Lectura del catálogo
El IDEAM (Instituto de Hidrología, Meteorología y Estudios Ambientales) mantiene un catálogo actualizado de más de 4.000 estaciones hidrometeorológicas activas, suspendidas o en mantenimiento. Este catálogo incluye estaciones limnimétricas, climáticas, agrometeorológicas, sinópticas, entre otras, distribuidas por todo el territorio nacional.
A continuación, mostramos cómo conectarse al portal y descargar el catálogo nacional de estaciones:
🔗 ¿Qué es una API?
Una API (Interfaz de Programación de Aplicaciones) permite que programas se comuniquen con bases de datos a través de internet. En lugar de descargar archivos CSV manualmente, podemos:
Consultar datos específicos de forma programática
Filtrar antes de descargar (más rápido, menos datos)
Acceder siempre a la versión más actualizada
La plataforma Socrata proporciona una API estandarizada usada por muchos portales de datos abiertos en el mundo, incluyendo datosabiertos
# Crear cliente sin autenticación (None)
client = Socrata("www.datos.gov.co", None)

# Descargar registros del catálogo nacional de estaciones (máx. 10,000)
results = client.get("hp9r-jxuu", limit=10000)

# Convertir los datos a un DataFrame de Pandas
df_cat = pd.DataFrame.from_records(results)
# Este conjunto de datos incluye la ubicación geográfica de cada estación en formato anidado (ubicaci_n),
# por lo que es necesario extraer manualmente las coordenadas:
df_cat["latitud"] = df_cat["ubicaci_n"].apply(lambda d: float(d["latitude"]))
df_cat["longitud"] = df_cat["ubicaci_n"].apply(lambda d: float(d["longitude"]))
WARNING:root:Requests made without an app_token will be subject to strict throttling limits.
df_cat.head()1.2 🗺️ Mapa de estaciones
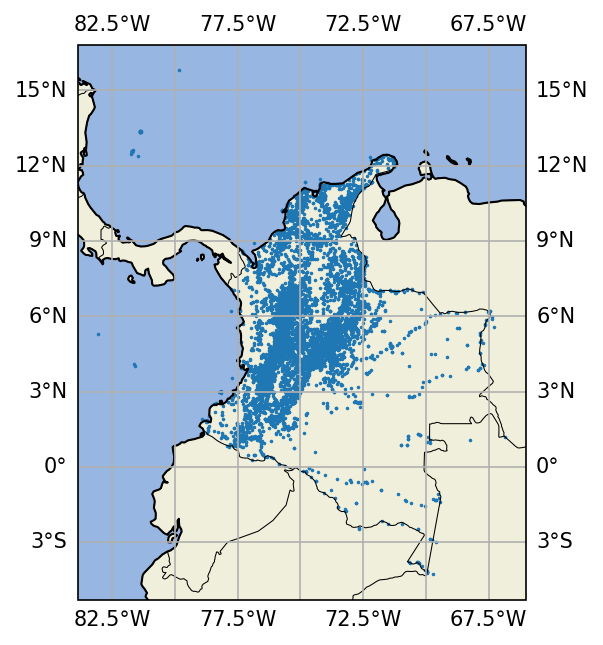
Una vez cargado el catálogo de estaciones, podemos visualizar su distribución geográfica mediante un mapa estático utilizando la librería Cartopy.
Este tipo de visualización nos permite identificar la cobertura espacial de la red de monitoreo del IDEAM, así como detectar posibles vacíos geográficos o concentraciones de estaciones en ciertas regiones del país.
A continuación, se muestra cómo generar un mapa base con las estaciones ubicadas mediante coordenadas geográficas (latitud y longitud).
fig, ax = plt.subplots(subplot_kw={"projection": ccrs.PlateCarree()}, dpi=150)
ax.coastlines()
gl = ax.gridlines(draw_labels=True, crs=ccrs.PlateCarree())
ax.scatter(df_cat["longitud"], df_cat["latitud"], transform=ccrs.PlateCarree(), s=0.5)
ax.add_feature(feature.LAND)
ax.add_feature(feature.OCEAN)
ax.add_feature(feature.COASTLINE, linewidth=0.5)
ax.add_feature(feature.BORDERS, linewidth=0.5);
/home/runner/micromamba/envs/cdh-python/lib/python3.13/site-packages/cartopy/io/__init__.py:242: DownloadWarning: Downloading: https://naturalearth.s3.amazonaws.com/50m_physical/ne_50m_land.zip
warnings.warn(f'Downloading: {url}', DownloadWarning)
/home/runner/micromamba/envs/cdh-python/lib/python3.13/site-packages/cartopy/io/__init__.py:242: DownloadWarning: Downloading: https://naturalearth.s3.amazonaws.com/50m_physical/ne_50m_ocean.zip
  warnings.warn(f'Downloading: {url}', DownloadWarning)
1.3 🗂️ Visualización por estado de las estaciones
Además de visualizar todas las estaciones en un único mapa, también es útil representar su distribución según el estado operativo: si están activas, en mantenimiento o suspendidas.
Esta visualización facilita:
Evaluar la cobertura real de la red de monitoreo actual (estaciones activas),
Identificar regiones con estaciones fuera de servicio,
Priorizar acciones de mantenimiento o rehabilitación.
df_grp = df_cat.groupby("estado")import cartopy.crs as ccrs
import cartopy.feature as feature
import matplotlib.pyplot as plt
fig, ax = plt.subplots(subplot_kw={"projection": ccrs.PlateCarree()}, dpi=150)
for _, group in df_grp:
ax.scatter(
group["longitud"],
group["latitud"],
transform=ccrs.PlateCarree(),
s=0.5,
label=_,
)
ax.coastlines()
gl = ax.gridlines(draw_labels=True, crs=ccrs.PlateCarree())
ax.add_feature(feature.LAND)
ax.add_feature(feature.OCEAN)
ax.add_feature(feature.COASTLINE, linewidth=0.5)
ax.add_feature(feature.BORDERS, linewidth=0.5)
ax.legend(fontsize=5);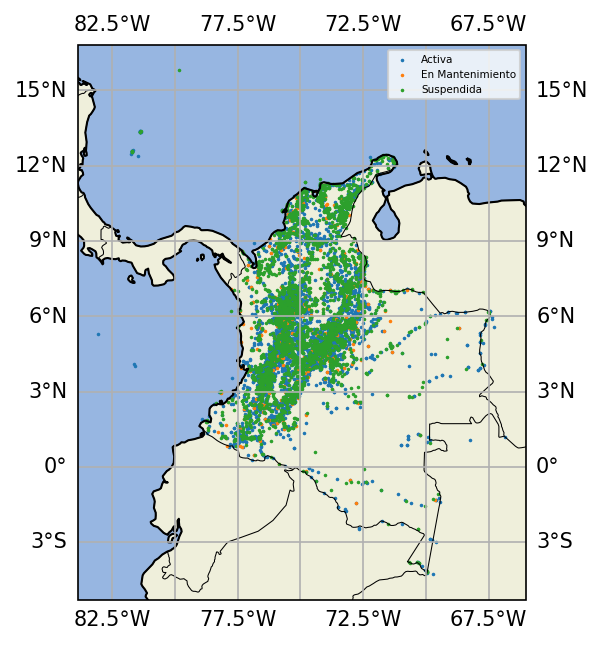
🏋️ Práctica 1: Explorando tu región
Ahora es tu turno de explorar el catálogo de estaciones.
Desafío:
Filtra las estaciones de tu departamento de interés
Cuenta cuántas estaciones hay por categoría
Identifica cuántas están activas vs suspendidas
Código inicial:
# Tu código aquí
mi_departamento = "CUNDINAMARCA"  # Cambia esto

# 1. Filtra por departamento
# df_mi_region = df_cat[df_cat["departamento"] == mi_departamento]

# 2. Cuenta por categoría
# print(df_mi_region["categoria"].value_counts())

# 3. Cuenta por estado
# print(df_mi_region["estado"].value_counts())
Solución
mi_departamento = "CUNDINAMARCA"
df_mi_region = df_cat[df_cat["departamento"] == mi_departamento]

print("Estaciones por categoría:")
print(df_mi_region["categoria"].value_counts())

print("\nEstaciones por estado:")
print(df_mi_region["estado"].value_counts())

print(f"\nTotal: {len(df_mi_region)} estaciones")
2. 🌧️ Consulta de datos históricos desde datosabiertos
Una vez conocemos la ubicación y estado de las estaciones hidrometeorológicas, podemos acceder a sus registros históricos —como precipitación, temperatura, humedad, presión, etc.— mediante la plataforma datosabiertos
Esta plataforma, basada en Socrata, ofrece una API pública que permite consultar y filtrar datos por estación, variable, fecha, entre otros criterios.
📌 Cada variable disponible tiene un identificador único llamado dataset_identifier. Por ejemplo:
s54a-sgyg: Precipitaciónsbwg-7ju4: Temperaturauext-mhny: Humedad relativa
En esta sección, aprenderás a:
Conectarte a la API de datos abiertos,
Consultar registros históricos de una estación específica,
Visualizar series temporales de variables como la precipitación y temperatura.
2.1 ☔ Consulta de datos de precipitación
Usaremos el identificador s54a-sgyg, correspondiente a registros de precipitación reportada por estaciones automáticas y convencionales.
Primero, realizamos una consulta general para descargar los primeros 2.000 registros:
# Crear cliente de conexión
client = Socrata("www.datos.gov.co", None)

# Descargar registros de precipitación (máximo 2000)
results = client.get("s54a-sgyg", limit=2000)
df_ppt = pd.DataFrame.from_records(results)
df_ppt.head()
WARNING:root:Requests made without an app_token will be subject to strict throttling limits.
El conjunto de datos incluye campos como:
fechaobservacion: fecha y hora de la mediciónvalorobservado: valor de precipitación (en mm)codigoestacionynombreestacionlatitudylongituddepartamento,municipio,zonahidrografica
2.2 🌡️ Serie temporal de temperatura para una estación específica
Ahora consultaremos la serie temporal de temperatura del aire registrada por la estación 0021205012, correspondiente a la Universidad Nacional, Bogotá, usando el conjunto de datos identificado como sbwg-7ju4.
Al tratarse de una serie histórica extensa, es posible que las solicitudes a la API tarden más de lo normal. Para evitar errores de tipo Timeout, recomendamos crear un cliente con un mayor tiempo de espera.
from sodapy import Socrata

# Crear un nuevo cliente con mayor tiempo de espera
client_long = Socrata("www.datos.gov.co", None, timeout=60)
WARNING:root:Requests made without an app_token will be subject to strict throttling limits.
temp_query = client_long.get(
    dataset_identifier="sbwg-7ju4",
    select="fechaobservacion, valorobservado, codigoestacion",
    where="codigoestacion IN ('0021205012') AND fechaobservacion > '2020-01' AND fechaobservacion < '2020-02'",
    limit=1000,
)


# Convertir resultados a DataFrame
df_temp = pd.DataFrame.from_records(temp_query)
df_temp.head()Convertimos los datos a los tipos adecuados antes de graficarlos:
# Conversión de tipos y orden temporal
df_temp["fechaobservacion"] = pd.to_datetime(df_temp["fechaobservacion"])
df_temp["valorobservado"] = df_temp["valorobservado"].astype(float)
df_temp.set_index("fechaobservacion", inplace=True)
df_temp = df_temp.sort_index()
df_temp.info()
<class 'pandas.core.frame.DataFrame'>
DatetimeIndex: 743 entries, 2020-01-01 01:00:00 to 2020-01-31 23:00:00
Data columns (total 2 columns):
# Column Non-Null Count Dtype
--- ------ -------------- -----
0 valorobservado 743 non-null float64
1 codigoestacion 743 non-null object
dtypes: float64(1), object(1)
memory usage: 17.4+ KB
Finalmente, graficamos la serie temporal de temperatura:
# Graficar serie de temperatura
fig, ax = plt.subplots(figsize=(12, 3))
df_temp["valorobservado"].plot(ax=ax, color="C1")

ax.set_title("Temperatura en la Estación 0021205012 (Universidad Nacional - Bogotá)")
ax.set_ylabel("Temperatura [°C]")
ax.set_xlabel("Fecha")

plt.tight_layout()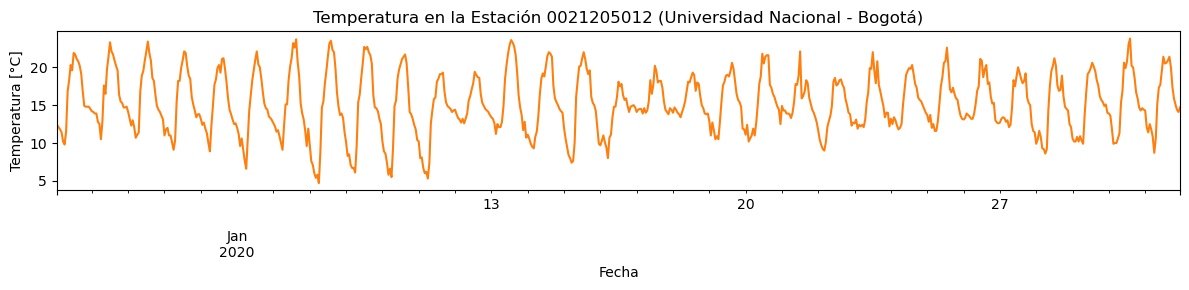
🏋️ Práctica 2: Consulta personalizada
Aplica lo aprendido consultando datos de una estación de tu interés.
Desafío: Consulta temperatura de otra estación para un mes diferente.
Pistas:
Dataset:
"sbwg-7ju4"Usa fechas recientes (ej. mes pasado)
Convierte tipos de datos antes de graficar
# Tu código aquí
# Elige tu estación y fechas, luego consulta y grafica3. ⏱️ Datos en tiempo “Cuasi-real” de IDEAM
Además del acceso a información histórica, el IDEAM publica un conjunto de datos adicional que contiene observaciones en tiempo cercano a la medición (también llamado cuasi-real). Este conjunto de datos está disponible en datosabiertos
```python dataset_identifier = “57sv-p2fu” ```
📡 Este conjunto de datos permite acceder a las lecturas más recientes reportadas por estaciones automáticas del IDEAM y de terceros, incluyendo variables como temperatura, precipitación, viento y presión, entre otros.
🚨 A diferencia de los conjuntos de datos históricos como s54a-sgyg (precipitación) o sbwg-7ju4 (temperatura), este recurso:
Está diseñado para monitoreo en línea o con muy poco retardo.
Puede contener observaciones con menor validación o control de calidad.
Agrupa datos de sensores diversos en una sola tabla.
Incluye estaciones del IDEAM y también estaciones de terceros.
A continuación, realizamos una consulta básica para ver qué columnas contiene esta tabla, filtrando las observaciones de los últimos 5 días:
from datetime import datetime, timedelta
from pandas import to_datetime

# Establecer rango de fechas recientes
fecha_inicio = datetime.now() - timedelta(days=5)
fecha_inicio_str = f"{to_datetime(fecha_inicio):%Y-%m-%d}"

# Consulta al dataset cuasi-real
nrt_query = client.get(
    dataset_identifier="57sv-p2fu",
    select="*",
    where=f"fechaobservacion >= '{fecha_inicio_str}'",
    limit=1000
)

# Convertir a DataFrame
df_nrt = pd.DataFrame.from_records(nrt_query)
df_nrt.head()🔎 Este conjunto de datos es ideal para desarrollar sistemas de monitoreo operativo, alertas tempranas, o visualizar fenómenos meteorológicos recientes. Sin embargo, no es recomendable usarlo directamente para análisis climatológicos de largo plazo debido a su naturaleza preliminar.
En la siguiente subsección exploraremos cómo filtrar los datos por estación y sensor, y generar una serie temporal.
3.1 📈 Serie temporal cuasi-real por estación y sensor
Podemos consultar datos cuasi-reales de una estación específica utilizando su codigoestacion y el codigosensor correspondiente a la variable de interés. Por ejemplo, el sensor 0071 reporta temperatura del aire.
A continuación, filtramos los datos recientes de la estación Aeropuerto Alberto Lleras Camargo (Sogamoso) con código 0024035340.
# Parámetros de consulta
cod_est = "0024035340"  # Aeropuerto de Sogamoso
cod_sensor = "0071"     # Sensor de temperatura

# Consulta de temperatura en tiempo cuasi-real
aero_query = client.get(
    dataset_identifier="57sv-p2fu",
    select="fechaobservacion, valorobservado",
    where=f"fechaobservacion >= '{fecha_inicio_str}' \
            AND codigoestacion IN ('{cod_est}') \
            AND codigosensor IN ('{cod_sensor}')",
    limit=2000
)

# Convertir a DataFrame
df_aero = pd.DataFrame.from_records(aero_query)
df_aero["fechaobservacion"] = pd.to_datetime(df_aero["fechaobservacion"])
df_aero["valorobservado"] = df_aero["valorobservado"].astype(float)
df_aero = df_aero.set_index("fechaobservacion").sort_index()df_aeroAhora generemos un gráfico rápido de la serie de temperatura para las últimas 24 horas
# Visualización de la serie temporal
fig, ax = plt.subplots(figsize=(10, 3))
df_aero["valorobservado"].plot(ax=ax, color="C1")

ax.set_title("Serie de temperatura (cuasi-real) - Aeropuerto Sogamoso")
ax.set_ylabel("Temperatura [°C]")
ax.set_xlabel("Fecha y hora")
ax.grid(True)
plt.tight_layout()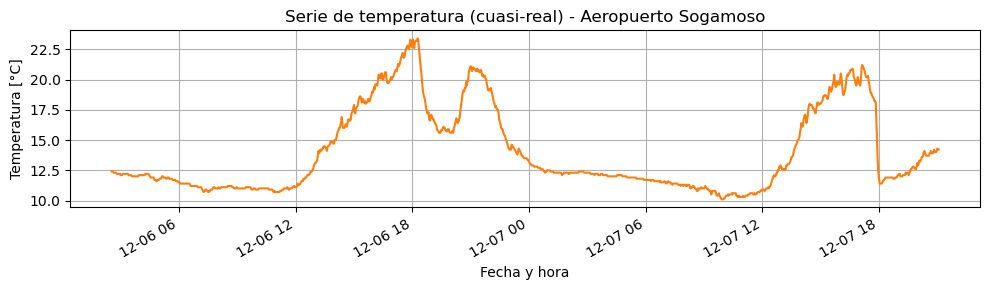
3.2 📊 Múltiples estaciones, un mismo sensor
También es posible consultar simultáneamente varias estaciones que reportan una misma variable —por ejemplo, temperatura del aire— filtrando por su codigoestacion y el mismo codigosensor.
A continuación, consultamos datos recientes del sensor de temperatura (codigosensor = "0071") para dos estaciones:
Aeropuerto de Sogamoso (
0024035340)Universidad Nacional, Bogotá (
0021205012)
# Estaciones a consultar
estaciones = {
    "0024035340": "Sogamoso - Aeropuerto",
    "0027015330": "AEROPUERTO OLAYA HERRERA"
}
sensor_temp = "0071"
estaciones_str = ", ".join([f"'{e}'" for e in estaciones.keys()])

# Consulta
multi_query = client.get(
    dataset_identifier="57sv-p2fu",
    select="fechaobservacion, valorobservado, codigoestacion",
    where=f"fechaobservacion >= '{fecha_inicio_str}' \
            AND codigosensor IN ('{sensor_temp}') \
            AND codigoestacion IN ({estaciones_str})",
    limit=3000
)

# Procesamiento
df_multi = pd.DataFrame.from_records(multi_query)
df_multi["fechaobservacion"] = pd.to_datetime(df_multi["fechaobservacion"])
df_multi["valorobservado"] = df_multi["valorobservado"].astype(float)
df_multi = df_multi.sort_values("fechaobservacion")
Antes de graficar los resultados, es importante asegurarnos de que los datos han sido correctamente transformados:
La columna
fechaobservaciondebe convertirse adatetime.El campo
valorobservadodebe convertirse afloat.Ordenamos los datos por fecha para asegurar una visualización coherente.
A continuación, graficamos la serie temporal de temperatura para cada estación, usando un color diferente por cada una.
# Gráfico
fig, ax = plt.subplots(figsize=(12, 4))

for codigo, nombre in estaciones.items():
    df_plot = df_multi[df_multi["codigoestacion"] == codigo]
    if not df_plot.empty:
        ax.plot(
            df_plot["fechaobservacion"],
            df_plot["valorobservado"],
            label=nombre,
            lw=1
        )
    else:
        print(f"⚠️ No hay datos recientes para la estación: {nombre}")

ax.set_title("Temperatura cuasi-real: Sogamoso vs. AEROPUERTO OLAYA HERRERA")
ax.set_ylabel("Temperatura [°C]")
ax.set_xlabel("Fecha y hora")
ax.legend(title="Estación")
ax.grid(True)
plt.tight_layout()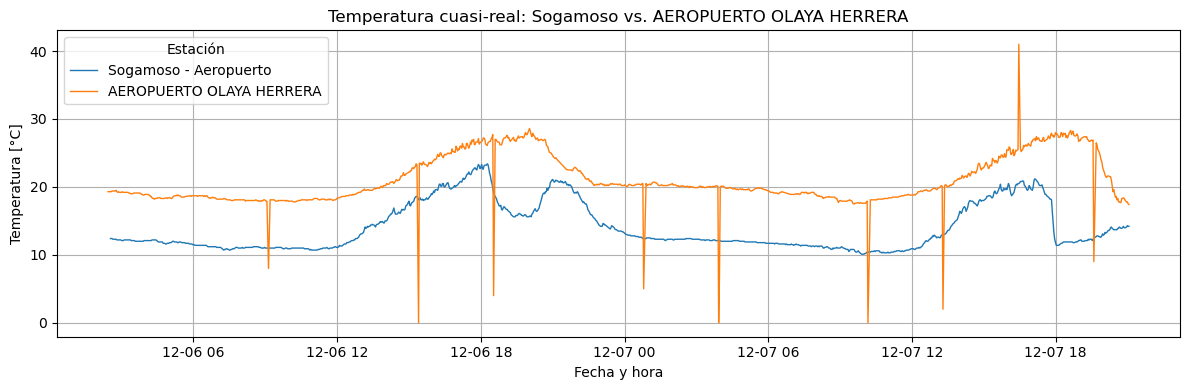
📌 Esta estrategia es útil para comparar condiciones meteorológicas en diferentes regiones del país en tiempo cuasi-real. Puedes usar esta técnica para otras variables como precipitación, humedad o viento, cambiando el codigosensor.
🔍 Si no conoces el código de sensor para una variable específica, puedes consultar los datos sin filtrar por codigosensor y luego explorar los valores únicos con:
```python df_nrt[“codigosensor”].unique() ```
✅ Resumen
¡Felicitaciones! Has desarrollado habilidades clave en acceso a datos hidrometeorológicos:
✅ Consultar APIs REST con Python usando Socrata/sodapy
✅ Procesar datos geoespaciales en formato tabular
✅ Visualizar estaciones sobre mapas con Cartopy
✅ Filtrar series temporales de variables meteorológicas
✅ Integrar datos históricos y en tiempo cuasi-real del IDEAM
🚀 ¿Qué sigue?
Ahora que dominas el acceso a datos de estaciones, puedes explorar:
[2.2. Radar meteorológico] - Datos de radar del IDEAM
[Aplicaciones científicas] - Análisis de ENSO y eventos extremos
Proyecto sugerido:
Desarrolla un sistema de monitoreo que descargue datos cuasi-reales cada hora y genere alertas cuando se superen umbrales de precipitación.
⚠️ Recuerda limitar el tamaño de las consultas realizadas a Socrata para evitar errores por tiempos de espera o restricciones de uso del API.
📚 Recursos y referencias
Rose, B. E. J., Kent, J., Tyle, K., Clyne, J., Banihirwe, A., Camron, D., May, R., Grover, M., Ford, R. R., Paul, K., Morley, J., Eroglu, O., Kailyn, L., & Zacharias, A. (2023). Pythia Foundations (Version v2023.05.01). Rose et al. (2023)
Portal de datos abiertos de Colombia – IDEAM:
https://www .datos .gov .co Documentación de Socrata Open Data API (SODA):
https://dev .socrata .com/ Repositorio de datos hidrometeorológicos crudos – IDEAM:
https://www .datos .gov .co /Ambiente -y -Desarrollo -Sostenible /Datos -Hidrometeorol -gicos -Crudos -Red -de -Estaciones /sbwg -7ju4 Cuaderno basado en la infraestructura educativa abierta del proyecto Project Pythia
- Rose, B., Kent, J., Tyle, K., Clyne, Banihirwe, A., Camron, D., Ford, R., Morley, J., Grover, M., Eroglu, O., Paul, K., May, R., Lkailynncar, Irving, D., Uieda, L., Ojaybee, Blain, P., & Moon, Z. (2023). ProjectPythia/pythia-foundations: v2023.05.01. Zenodo. 10.5281/ZENODO.7884572