NASA API: World Map of Fireball Impacts
Overview
This notebook will cover all the steps to access bright meteor and fireball impact data collected by NASA’s CNEOS and produce a global plot of impact sites
Prerequisites
CNEOS Overview
Imports
Access and Organize Data
Plot Earth Fireball Impacts
Summary
Prerequisites
| Concepts | Importance | Notes |
|---|---|---|
| Intro to Matplotlib | Necessary | Plotting on a data |
| Intro to GeoPandas | Necessary | Plotting on a world map |
| Intro to Pandas | Necessary | Familiarity with working with dataframes |
CNEOS Overivew
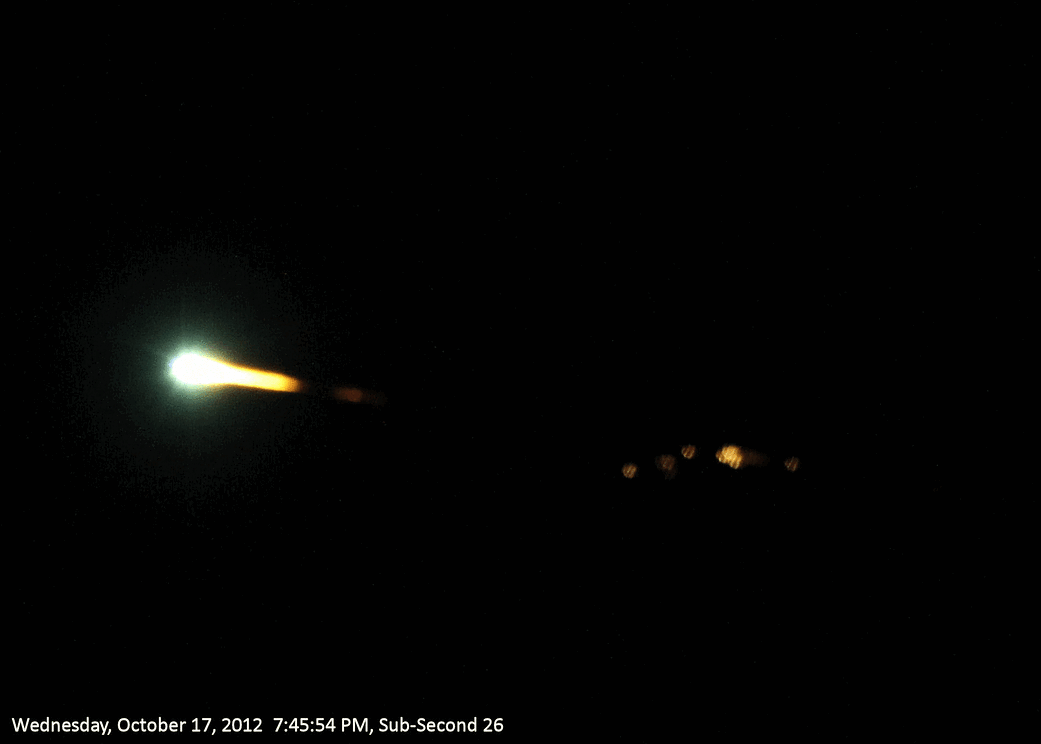
A shooting star is a common term for a meteor and form bright trails of light that are often bright enough to be visible during the day. A “fireball” is a term for expectionally bright meteor that enters the Earth’s atmosphere at high speeds. A meteor that form fireballs can be over one meter long. A “bolide” typically refers to a fireball that breaks up in the atmosphere. These objects are tracked by the Center for Near Earth Object Studies (CNEOS) and information about the Peak Brightness, Velocity, and Joules of energy radiatated can be retrieved from CNEOS via an API
Fireball Data API
This notebook will query the Fireball API for data from the last decade of observations
JPL’s Center for Near-Earth Objects Studies API “Fireball” is an API that will return machine-readable data in the form of a JSON.
All queries to the Fireball Data API make requests to https://ssd-api.jpl.nasa.gov/fireball.api
The API accepts different query parameters to filter the data
Directly querying https://ssd-api.jpl.nasa.gov/fireball.api will return all the data of fireball impacts in reverse-chronological order
| Parameter | Type | Description |
|---|---|---|
| date-min | string | exclude data earlier than this date YYYY-MM-DD or date/time YYYY-MM-DDThh:mm:ss |
| date-max | string | exclude data later than this date YYYY-MM-DD or date/time YYYY-MM-DDThh:mm:ss |
| energy-min | string | exclude data with total-radiated-energy less than this positive value in joules ×1010 (e.g., 0.3 = 0.3×10¹⁰ joules) |
| energy-max | string | exclude data with total-radiated-energy greater than this (see energy-min) |
| impact-e-min | string | exclude data with estimated impact energy less than this positive value in kilotons (kt) (e.g., 0.08 kt) |
| impact-e-max | string | exclude data with total-radiated-energy greater than this (see impact-e-min) |
| alt-min | number | exclude data from objects with an altitude less than this (e.g., 22 meaning objects smaller than this) |
| alt-max | number | exclude data from objects with an altitude greater than this (e.g., 17.75 meaning objects larger than this) |
| req-loc | boolean | location (latitude and longitude) required; when set true, exclude data without a location |
| req-alt | boolean | altitude required; when set true, exclude data without an altitude |
| req-vel-comp | boolean | pre-entry velocity components required; when set true, exclude data without pre-entry velocity components |
| vel-comp | boolean | include pre-entry velocity components |
| sort | string | sort data on the specified field: “date”, “energy”, “impact-e”, “vel”, or “alt” (default sort order is ascending: prepend “-“ for descending) |
| limit | number | limit data to the first N results (where N is the specified number and must be an integer value greater than zero) |
Results from API will be returned as JSON with a number of fields
| Field | Description |
|---|---|
| date | date/time of peak brightness (GMT) |
| lat | latitude at peak brightness (degrees) |
| lon | longitude at peak brightness (degrees) |
| lat-dir | latitude direction (“N” or “S”) |
| lon-dir | latitude direction (“E” or “W”) |
| alt | altitude above the geoid at peak brightness (km) |
| energy | approximate total radiated energy (10^10 joules) |
| impact-e | approximate total impact energy (kt) |
| vx | pre-entry velocity (Earth centered X component, km/s) |
| vy | pre-entry velocity (Earth centered Y component, km/s) |
| vz | pre-entry velocity (Earth centered Z component, km/s) |
Example JSON result
Return the last 3 records https://ssd-api.jpl.nasa.gov/fireball.api?limit=3
{
    "signature":
        {
            "version":"1.0",
            "source":"NASA/JPL Fireball Data API"
        },
    "count":"3",
    "fields":["date","energy","impact-e","lat","lat-dir","lon","lon-dir","alt","vel"],
    "data":[
        ["2024-06-03 01:13:51","2.6","0.092","63.1","S","53.2","W","60.0",null],
        ["2024-06-01 23:24:59","7.9","0.25","1.0","S","15.9","W","26.5","12.6"],
        ["2024-05-27 03:19:36","8.4","0.26","1.7","N","39.4","W","56.0","39.2"]
    ]
}
Imports
import requests                  # submit API request query
import pandas as pd              # organizes data retrieved by the API
import geopandas                 # generate a world map
import matplotlib.pyplot as plt  # plotting data
Request Fireball Data via API
To retrieve all the fireballs recorded in the last decade (2014-2024)
data_since = "2014-01-01"
last_decade_fireball = requests.get(f"https://ssd-api.jpl.nasa.gov/fireball.api?date-min={data_since}")
last_decade_fireball.status_code # 200 is a valid request200fireball_json = last_decade_fireball.json()# print out data labels
print(f"fields = {fireball_json['fields']}")fields = ['date', 'energy', 'impact-e', 'lat', 'lat-dir', 'lon', 'lon-dir', 'alt', 'vel']
# convert JSON data to a Pandas dataframe
fireball_df = pd.DataFrame(fireball_json["data"], columns=fireball_json["fields"])
fireball_df# remove nan and duplicated data rows and reindex rows
fireball_df.dropna(inplace=True, ignore_index=True)
# convert columnss from strings to a float
fireball_df["energy"] = fireball_df["energy"].astype(float)
fireball_df["impact-e"] = fireball_df["impact-e"].astype(float)
fireball_df["lat"] = fireball_df["lat"].astype(float)
fireball_df["lon"] = fireball_df["lon"].astype(float)
fireball_df["alt"] = fireball_df["alt"].astype(float)
fireball_df["vel"] = fireball_df["vel"].astype(float)
# convert latitude to negative if lat-dir is S and longitude to negative if lon-dir is W
fireball_df['lat'] = fireball_df['lat'].mask(fireball_df['lat-dir'].eq('S'), -fireball_df['lat'])
fireball_df['lon'] = fireball_df['lon'].mask(fireball_df['lon-dir'].eq('W'), -fireball_df['lon'])
# rename columns
fireball_df = fireball_df.rename(columns= {"impact-e": "impact energy",
"lat": "latitude",
"lat-dir": "latitude direction",
"lon": "longitude",
"lon-dir": "longitude direction",
"alt": "altitude",
"vel": "velocity"})
fireball_dffireball_df.info()<class 'pandas.DataFrame'>
RangeIndex: 269 entries, 0 to 268
Data columns (total 9 columns):
# Column Non-Null Count Dtype
--- ------ -------------- -----
0 date 269 non-null str
1 energy 269 non-null float64
2 impact energy 269 non-null float64
3 latitude 269 non-null float64
4 latitude direction 269 non-null str
5 longitude 269 non-null float64
6 longitude direction 269 non-null str
7 altitude 269 non-null float64
8 velocity 269 non-null float64
dtypes: float64(6), str(3)
memory usage: 24.7 KB
Plot the Energy of Fireballs
# retrieve world map from GeoPandas
world_map = geopandas.read_file("https://naciscdn.org/naturalearth/110m/cultural/ne_110m_admin_0_countries.zip")

# Set up world map plot
fig, ax = plt.subplots(figsize=(15, 10))
world_map.plot(color="grey", ax=ax)

# Plot Fireball Locations with Energy
x = fireball_df["longitude"]
y = fireball_df["latitude"]
z = fireball_df["energy"]
plt.scatter(x, y, s=5*z, c=z, cmap="autumn")
plt.colorbar(label="Approximate Total Radiated Energy (10^10 Joules)")

# Setup Axis Limits and Title/Labels
plt.xlim([-180, 180])
plt.ylim([-90, 90])
plt.title("Energy of Fireball Observations")
plt.xlabel("Longitude (Degrees)")
plt.ylabel("Latitude (Degrees)")
plt.show()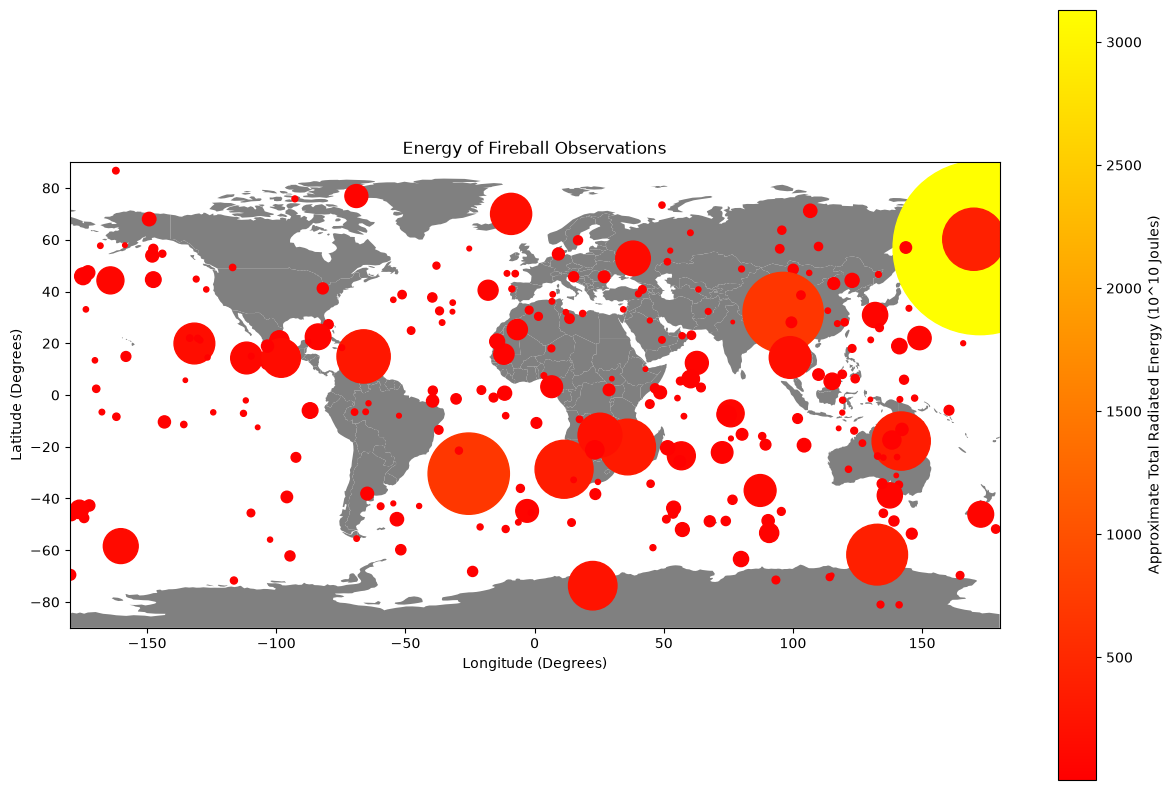
Plot the Impact Energy of Fireballs
# retrieve world map from GeoPandas
world_map = geopandas.read_file("https://naciscdn.org/naturalearth/110m/cultural/ne_110m_admin_0_countries.zip")

# Set up world map plot
fig, ax = plt.subplots(figsize=(15, 10))
world_map.plot(color="grey", ax=ax)

# Plot Fireball Locations with Energy
x = fireball_df["longitude"]
y = fireball_df["latitude"]
z = fireball_df["impact energy"]
plt.scatter(x, y, s=5*z, c=z, cmap="autumn")
plt.colorbar(label="Approximate Total Impact Energy (kt)")

# Setup Axis Limits and Title/Labels
plt.xlim([-180, 180])
plt.ylim([-90, 90])
plt.title("Total Impact Energy of Fireball Observations")
plt.xlabel("Longitude (Degrees)")
plt.ylabel("Latitude (Degrees)")
plt.show()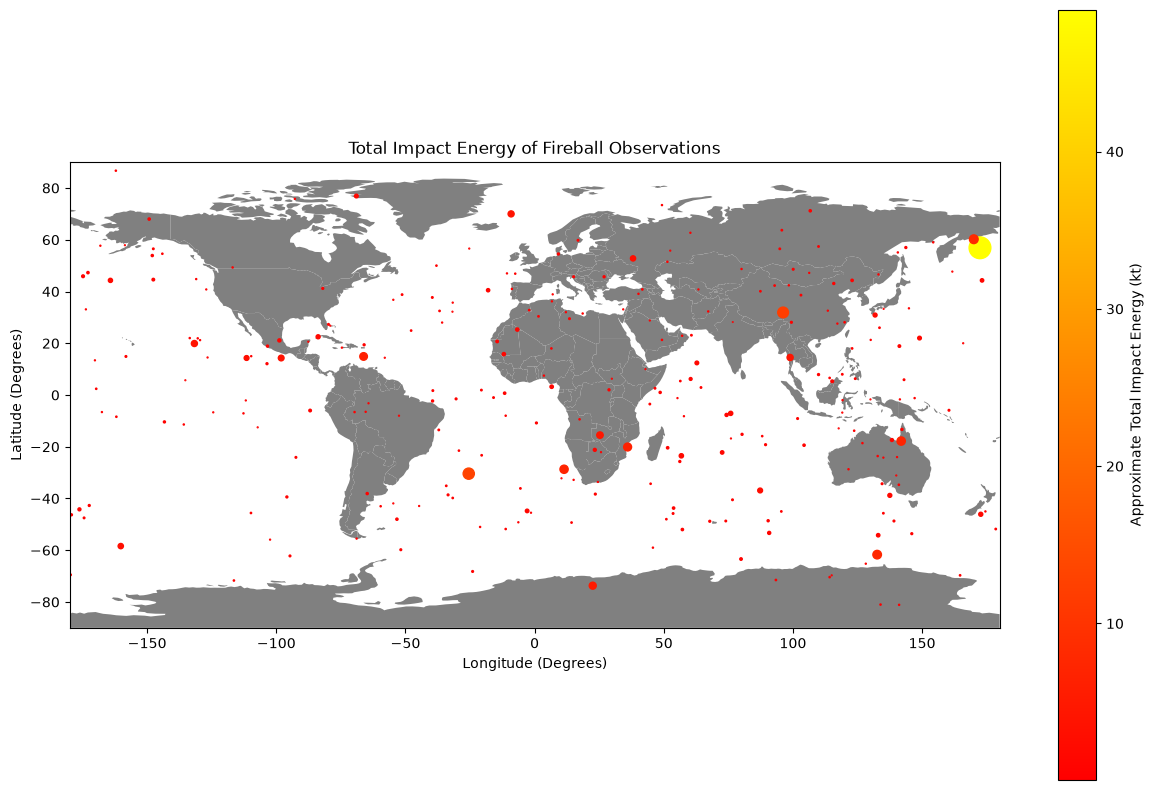
Plot the Velocity of Fireballs
# retrieve world map from GeoPandas
world_map = geopandas.read_file("https://naciscdn.org/naturalearth/110m/cultural/ne_110m_admin_0_countries.zip")

# Set up world map plot
fig, ax = plt.subplots(figsize=(15, 10))
world_map.plot(color="grey", ax=ax)

# Plot Fireball Locations with Velocity
x = fireball_df["longitude"]
y = fireball_df["latitude"]
z = fireball_df["velocity"]
plt.scatter(x, y, s=5*z, c=z, cmap="winter")
plt.colorbar(label="Pre-Entry Velocity (km/s)")

# Setup Axis Limits and Title/Labels
plt.xlim([-180, 180])
plt.ylim([-90, 90])
plt.title("Pre-Entry Velocity of Fireball Observations")
plt.xlabel("Longitude (Degrees)")
plt.ylabel("Latitude (Degrees)")
plt.show()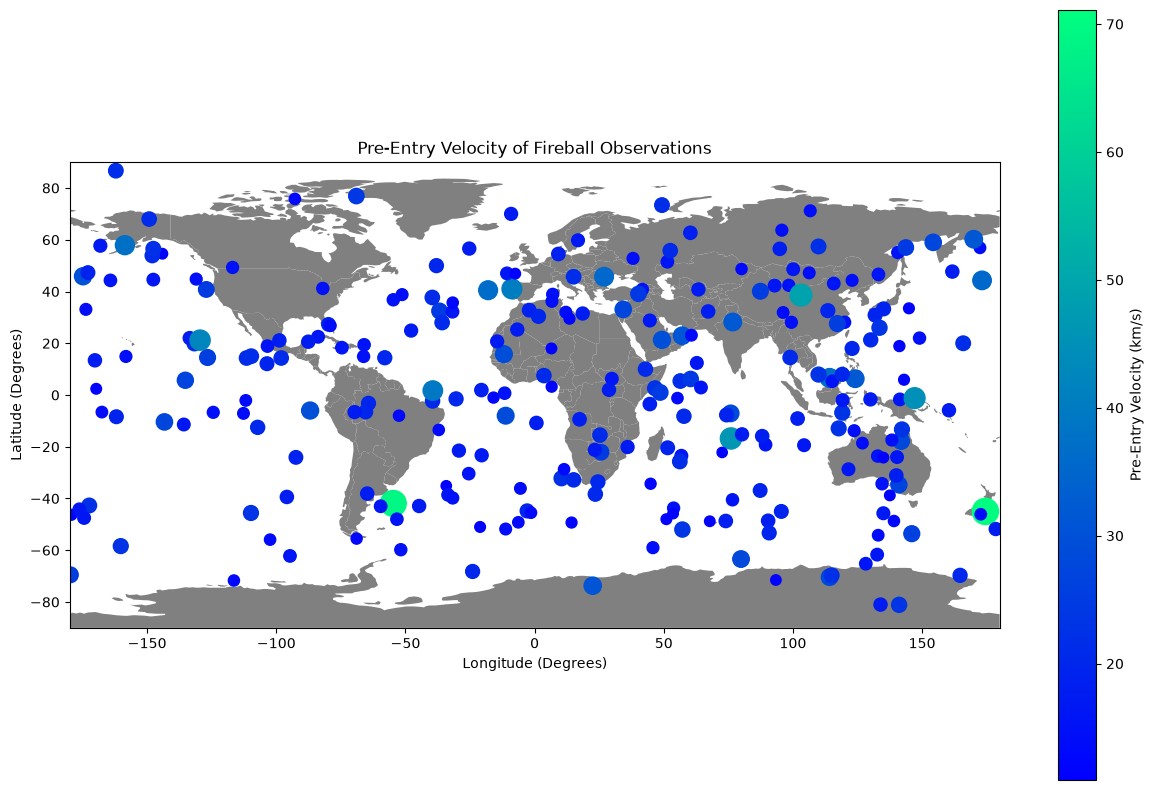
Plot the Altitude of Fireballs
# retrieve world map from GeoPandas
world_map = geopandas.read_file("https://naciscdn.org/naturalearth/110m/cultural/ne_110m_admin_0_countries.zip")

# Set up world map plot
fig, ax = plt.subplots(figsize=(15, 10))
world_map.plot(color="grey", ax=ax)

# Plot Fireball Locations with Energy
x = fireball_df["longitude"]
y = fireball_df["latitude"]
z = fireball_df["altitude"]
plt.scatter(x, y, s=5*z, c=z, cmap="bone")
plt.colorbar(label="Altitude Above Geoid at Peak Brightness (km)")

# Setup Axis Limits and Title/Labels
plt.xlim([-180, 180])
plt.ylim([-90, 90])
plt.title("Altitude of Fireball Observations")
plt.xlabel("Longitude (Degrees)")
plt.ylabel("Latitude (Degrees)")
plt.show()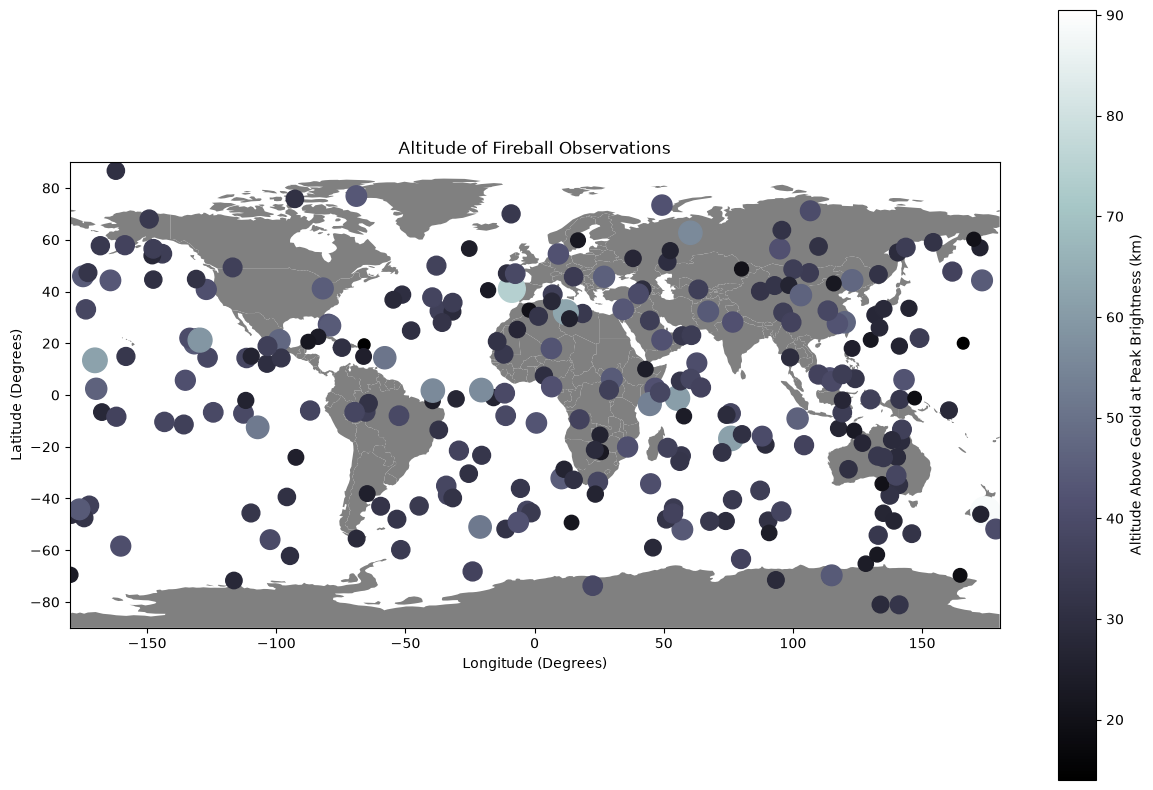
Resources and references
More information about plotting a world map with GeoPandas