CMIP6 image

Google Cloud CMIP6 Public Data: Basic Python Example


Overview

This notebooks shows how to query the Google Cloud CMIP6 catalog and load the data using Python.

Prerequisites

Concepts

Importance

Notes

Intro to Xarray

Necessary

Understanding of NetCDF

Helpful

Familiarity with metadata structure

  • Time to learn: 10 minutes


Imports

from matplotlib import pyplot as plt
import numpy as np
import pandas as pd
import xarray as xr
import zarr
import fsspec
import nc_time_axis

%matplotlib inline
plt.rcParams['figure.figsize'] = 12, 6

Browse Catalog

The data catatalog is stored as a CSV file. Here we read it with Pandas.

df = pd.read_csv('https://storage.googleapis.com/cmip6/cmip6-zarr-consolidated-stores.csv')
df.head()
activity_id institution_id source_id experiment_id member_id table_id variable_id grid_label zstore dcpp_init_year version
0 HighResMIP CMCC CMCC-CM2-HR4 highresSST-present r1i1p1f1 Amon ps gn gs://cmip6/CMIP6/HighResMIP/CMCC/CMCC-CM2-HR4/... NaN 20170706
1 HighResMIP CMCC CMCC-CM2-HR4 highresSST-present r1i1p1f1 Amon rsds gn gs://cmip6/CMIP6/HighResMIP/CMCC/CMCC-CM2-HR4/... NaN 20170706
2 HighResMIP CMCC CMCC-CM2-HR4 highresSST-present r1i1p1f1 Amon rlus gn gs://cmip6/CMIP6/HighResMIP/CMCC/CMCC-CM2-HR4/... NaN 20170706
3 HighResMIP CMCC CMCC-CM2-HR4 highresSST-present r1i1p1f1 Amon rlds gn gs://cmip6/CMIP6/HighResMIP/CMCC/CMCC-CM2-HR4/... NaN 20170706
4 HighResMIP CMCC CMCC-CM2-HR4 highresSST-present r1i1p1f1 Amon psl gn gs://cmip6/CMIP6/HighResMIP/CMCC/CMCC-CM2-HR4/... NaN 20170706

The columns of the dataframe correspond to the CMI6 controlled vocabulary.

Here we filter the data to find monthly surface air temperature for historical experiments.

df_ta = df.query("activity_id=='CMIP' & table_id == 'Amon' & variable_id == 'tas' & experiment_id == 'historical'")
df_ta
activity_id institution_id source_id experiment_id member_id table_id variable_id grid_label zstore dcpp_init_year version
973 CMIP NOAA-GFDL GFDL-ESM4 historical r3i1p1f1 Amon tas gr1 gs://cmip6/CMIP6/CMIP/NOAA-GFDL/GFDL-ESM4/hist... NaN 20180701
1766 CMIP NOAA-GFDL GFDL-ESM4 historical r2i1p1f1 Amon tas gr1 gs://cmip6/CMIP6/CMIP/NOAA-GFDL/GFDL-ESM4/hist... NaN 20180701
8074 CMIP NOAA-GFDL GFDL-CM4 historical r1i1p1f1 Amon tas gr1 gs://cmip6/CMIP6/CMIP/NOAA-GFDL/GFDL-CM4/histo... NaN 20180701
22185 CMIP IPSL IPSL-CM6A-LR historical r8i1p1f1 Amon tas gr gs://cmip6/CMIP6/CMIP/IPSL/IPSL-CM6A-LR/histor... NaN 20180803
22298 CMIP IPSL IPSL-CM6A-LR historical r2i1p1f1 Amon tas gr gs://cmip6/CMIP6/CMIP/IPSL/IPSL-CM6A-LR/histor... NaN 20180803
... ... ... ... ... ... ... ... ... ... ... ...
522952 CMIP MRI MRI-ESM2-0 historical r7i1p1f1 Amon tas gn gs://cmip6/CMIP6/CMIP/MRI/MRI-ESM2-0/historica... NaN 20210813
523274 CMIP MRI MRI-ESM2-0 historical r6i1p1f1 Amon tas gn gs://cmip6/CMIP6/CMIP/MRI/MRI-ESM2-0/historica... NaN 20210907
523712 CMIP CMCC CMCC-CM2-SR5 historical r3i1p2f1 Amon tas gn gs://cmip6/CMIP6/CMIP/CMCC/CMCC-CM2-SR5/histor... NaN 20211108
523721 CMIP CMCC CMCC-CM2-SR5 historical r2i1p2f1 Amon tas gn gs://cmip6/CMIP6/CMIP/CMCC/CMCC-CM2-SR5/histor... NaN 20211109
523769 CMIP EC-Earth-Consortium EC-Earth3-Veg historical r1i1p1f1 Amon tas gr gs://cmip6/CMIP6/CMIP/EC-Earth-Consortium/EC-E... NaN 20211207

635 rows × 11 columns

Now we do further filtering to find just the models from NCAR.

df_ta_ncar = df_ta.query('institution_id == "NCAR"')
df_ta_ncar
activity_id institution_id source_id experiment_id member_id table_id variable_id grid_label zstore dcpp_init_year version
56049 CMIP NCAR CESM2-WACCM historical r2i1p1f1 Amon tas gn gs://cmip6/CMIP6/CMIP/NCAR/CESM2-WACCM/histori... NaN 20190227
56143 CMIP NCAR CESM2-WACCM historical r3i1p1f1 Amon tas gn gs://cmip6/CMIP6/CMIP/NCAR/CESM2-WACCM/histori... NaN 20190227
56326 CMIP NCAR CESM2-WACCM historical r1i1p1f1 Amon tas gn gs://cmip6/CMIP6/CMIP/NCAR/CESM2-WACCM/histori... NaN 20190227
59875 CMIP NCAR CESM2 historical r1i1p1f1 Amon tas gn gs://cmip6/CMIP6/CMIP/NCAR/CESM2/historical/r1... NaN 20190308
61655 CMIP NCAR CESM2 historical r4i1p1f1 Amon tas gn gs://cmip6/CMIP6/CMIP/NCAR/CESM2/historical/r4... NaN 20190308
61862 CMIP NCAR CESM2 historical r5i1p1f1 Amon tas gn gs://cmip6/CMIP6/CMIP/NCAR/CESM2/historical/r5... NaN 20190308
62691 CMIP NCAR CESM2 historical r2i1p1f1 Amon tas gn gs://cmip6/CMIP6/CMIP/NCAR/CESM2/historical/r2... NaN 20190308
63131 CMIP NCAR CESM2 historical r3i1p1f1 Amon tas gn gs://cmip6/CMIP6/CMIP/NCAR/CESM2/historical/r3... NaN 20190308
63266 CMIP NCAR CESM2 historical r6i1p1f1 Amon tas gn gs://cmip6/CMIP6/CMIP/NCAR/CESM2/historical/r6... NaN 20190308
64615 CMIP NCAR CESM2 historical r8i1p1f1 Amon tas gn gs://cmip6/CMIP6/CMIP/NCAR/CESM2/historical/r8... NaN 20190311
64914 CMIP NCAR CESM2 historical r7i1p1f1 Amon tas gn gs://cmip6/CMIP6/CMIP/NCAR/CESM2/historical/r7... NaN 20190311
64983 CMIP NCAR CESM2 historical r9i1p1f1 Amon tas gn gs://cmip6/CMIP6/CMIP/NCAR/CESM2/historical/r9... NaN 20190311
66341 CMIP NCAR CESM2 historical r10i1p1f1 Amon tas gn gs://cmip6/CMIP6/CMIP/NCAR/CESM2/historical/r1... NaN 20190313
200772 CMIP NCAR CESM2 historical r11i1p1f1 Amon tas gn gs://cmip6/CMIP6/CMIP/NCAR/CESM2/historical/r1... NaN 20190514
385224 CMIP NCAR CESM2-FV2 historical r1i1p1f1 Amon tas gn gs://cmip6/CMIP6/CMIP/NCAR/CESM2-FV2/historica... NaN 20191120
386297 CMIP NCAR CESM2-WACCM-FV2 historical r1i1p1f1 Amon tas gn gs://cmip6/CMIP6/CMIP/NCAR/CESM2-WACCM-FV2/his... NaN 20191120
420771 CMIP NCAR CESM2-WACCM-FV2 historical r3i1p1f1 Amon tas gn gs://cmip6/CMIP6/CMIP/NCAR/CESM2-WACCM-FV2/his... NaN 20200226
421251 CMIP NCAR CESM2-WACCM-FV2 historical r2i1p1f1 Amon tas gn gs://cmip6/CMIP6/CMIP/NCAR/CESM2-WACCM-FV2/his... NaN 20200226
422013 CMIP NCAR CESM2-FV2 historical r3i1p1f1 Amon tas gn gs://cmip6/CMIP6/CMIP/NCAR/CESM2-FV2/historica... NaN 20200226
422459 CMIP NCAR CESM2-FV2 historical r2i1p1f1 Amon tas gn gs://cmip6/CMIP6/CMIP/NCAR/CESM2-FV2/historica... NaN 20200226

Load Data

Now we will load a single store using fsspec, zarr, and xarray.

# get the path to a specific zarr store (the first one from the dataframe above)
zstore = df_ta_ncar.zstore.values[-1]
print(zstore)

# create a mutable-mapping-style interface to the store
mapper = fsspec.get_mapper(zstore)

# open it using xarray and zarr
ds = xr.open_zarr(mapper, consolidated=True)
ds
gs://cmip6/CMIP6/CMIP/NCAR/CESM2-FV2/historical/r2i1p1f1/Amon/tas/gn/v20200226/
<xarray.Dataset>
Dimensions:    (lat: 96, nbnd: 2, lon: 144, time: 1980)
Coordinates:
  * lat        (lat) float64 -90.0 -88.11 -86.21 -84.32 ... 86.21 88.11 90.0
    lat_bnds   (lat, nbnd) float64 dask.array<chunksize=(96, 2), meta=np.ndarray>
  * lon        (lon) float64 0.0 2.5 5.0 7.5 10.0 ... 350.0 352.5 355.0 357.5
    lon_bnds   (lon, nbnd) float64 dask.array<chunksize=(144, 2), meta=np.ndarray>
  * time       (time) object 1850-01-15 12:00:00 ... 2014-12-15 12:00:00
    time_bnds  (time, nbnd) object dask.array<chunksize=(1980, 2), meta=np.ndarray>
Dimensions without coordinates: nbnd
Data variables:
    tas        (time, lat, lon) float32 dask.array<chunksize=(990, 96, 144), meta=np.ndarray>
Attributes: (12/48)
    Conventions:                     CF-1.7 CMIP-6.2
    DODS_EXTRA.Unlimited_Dimension:  time
    activity_id:                     CMIP
    branch_method:                   standard
    branch_time_in_child:            674885.0
    branch_time_in_parent:           10950.0
    ...                              ...
    tracking_id:                     hdl:21.14100/99cdfde8-5b6d-452b-9b78-62a...
    variable_id:                     tas
    variant_info:                    CMIP6 CESM2-FV2 historical experiment (1...
    variant_label:                   r2i1p1f1
    netcdf_tracking_ids:             hdl:21.14100/99cdfde8-5b6d-452b-9b78-62a...
    version_id:                      v20200226

Plot a map from a specific date:

ds.tas.sel(time='1950-01').squeeze().plot()
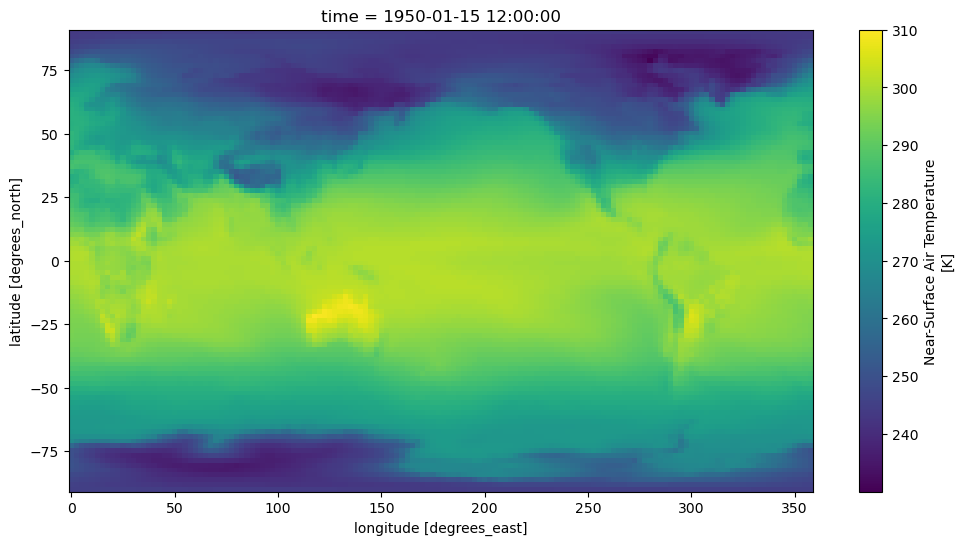
<matplotlib.collections.QuadMesh at 0x7f1ee8b571c0>
../../_images/04bc4411c28a9526620e7ba874a15f1142d5c6962ac138dd8f48059174a7fc62.png

Create a timeseries of global-average surface air temperature. For this we need the area weighting factor for each gridpoint.

df_area = df.query("variable_id == 'areacella' & source_id == 'CESM2'")
ds_area = xr.open_zarr(fsspec.get_mapper(df_area.zstore.values[0]), consolidated=True)
ds_area
<xarray.Dataset>
Dimensions:    (lat: 192, lon: 288, nbnd: 2)
Coordinates:
  * lat        (lat) float64 -90.0 -89.06 -88.12 -87.17 ... 88.12 89.06 90.0
    lat_bnds   (lat, nbnd) float32 dask.array<chunksize=(192, 2), meta=np.ndarray>
  * lon        (lon) float64 0.0 1.25 2.5 3.75 5.0 ... 355.0 356.2 357.5 358.8
    lon_bnds   (lon, nbnd) float32 dask.array<chunksize=(288, 2), meta=np.ndarray>
Dimensions without coordinates: nbnd
Data variables:
    areacella  (lat, lon) float32 dask.array<chunksize=(192, 288), meta=np.ndarray>
Attributes: (12/47)
    Conventions:            CF-1.7 CMIP-6.2
    activity_id:            CMIP
    branch_method:          no parent
    branch_time_in_child:   711385.0
    branch_time_in_parent:  0.0
    case_id:                38
    ...                     ...
    variable_id:            areacella
    variant_info:           f.e21.FHIST_BGC.f09_f09_mg17.CMIP6-AMIP.001 
\n
\...
    variant_label:          r1i1p1f1
    status:                 2019-11-04;created;by nhn2@columbia.edu
    netcdf_tracking_ids:    hdl:21.14100/23fa9dc3-4f8f-4943-b99b-58eb804c06f0
    version_id:             v20190218
total_area = ds_area.areacella.sum(dim=['lon', 'lat'])
ta_timeseries = (ds.tas * ds_area.areacella).sum(dim=['lon', 'lat']) / total_area
ta_timeseries
<xarray.DataArray (time: 1980)>
dask.array<truediv, shape=(1980,), dtype=float32, chunksize=(990,), chunktype=numpy.ndarray>
Coordinates:
  * time     (time) object 1850-01-15 12:00:00 ... 2014-12-15 12:00:00

By default the data are loaded lazily, as Dask arrays. Here we trigger computation explicitly.

%time ta_timeseries.load()
CPU times: user 369 ms, sys: 187 ms, total: 556 ms
Wall time: 1.54 s
<xarray.DataArray (time: 1980)>
array([0.00407822, 0.00405088, 0.0039282 , ..., 0.00411686, 0.00414686,
       0.00418852], dtype=float32)
Coordinates:
  * time     (time) object 1850-01-15 12:00:00 ... 2014-12-15 12:00:00
ta_timeseries.plot(label='monthly')
ta_timeseries.rolling(time=12).mean().plot(label='12 month rolling mean')
plt.legend()
plt.title('Global Mean Surface Air Temperature')
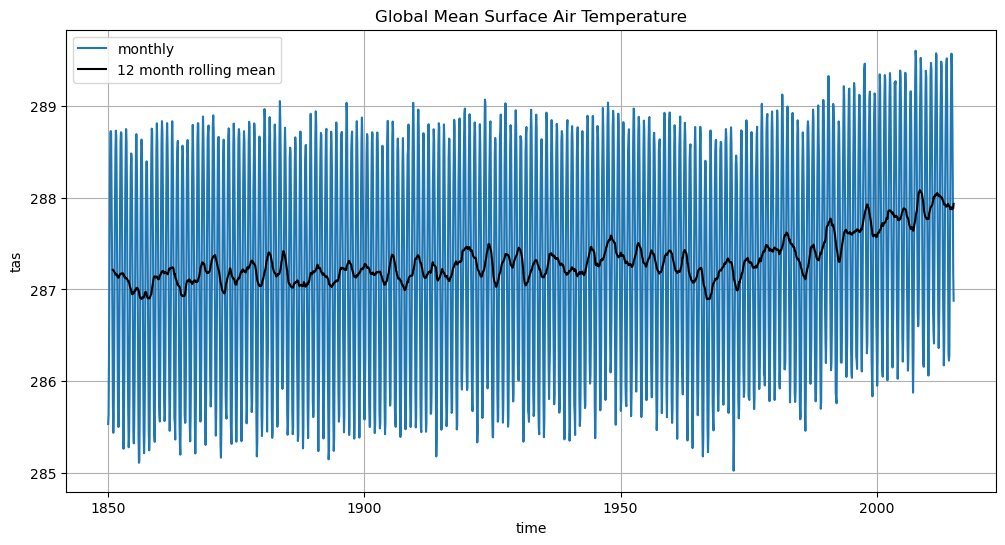
Text(0.5, 1.0, 'Global Mean Surface Air Temperature')
../../_images/45647336fa4adaf2fdfa04587186f7dc9cbf4e75b29f041470ba2a6e7f1027aa.png

Summary

In this notebook, we opened a CESM2 dataset with fsspec and zarr. We also used a cell area dataset to calculate and plot global average surface air temperature.

What’s next?

We will open a dataset with ESGF and OPenDAP.

Resources and references