AI-Powered Prediction & Machine Learning with Palmer Penguins
🤖 From Visualization to Prediction: Your Next AI Journey!
This chapter demonstrates how AI can take you beyond descriptive analytics into the powerful world of predictive modeling. You’ll learn to build machine learning models that don’t just show you what happened—they predict what will happen next.
By the end of this chapter, you’ll understand:
How to transition from visualization to prediction with AI assistance
Building your first machine learning classifier
Evaluating model performance and understanding predictions
Best practices for AI-assisted machine learning workflows
🎯 The WHAT, HOW, and WHY of Predictive AI
📖 WHAT: Understanding Machine Learning in Your Workflow
Key Insight: Machine learning is the natural next step after data visualization. While charts show you patterns in historical data, ML models learn those patterns to make predictions about new, unseen data.
Think of AI-powered machine learning as your intelligent pattern recognition system that brings:
🧠 Pattern Learner: Identifies complex relationships in your data
🔮 Future Predictor: Makes informed predictions about new cases
⚖️ Decision Assistant: Provides confidence scores and reasoning
🎯 Performance Monitor: Evaluates and improves prediction accuracy
Key Machine Learning Integration Points:
Data Preprocessing & Feature Engineering
Model Selection & Training
Prediction Generation & Validation
Performance Evaluation & Interpretation
Model Deployment & Monitoring
import pandas as pd

# GitHub URL for the CSV file (raw format)
url = "https://raw.githubusercontent.com/allisonhorst/palmerpenguins/master/inst/extdata/penguins.csv"

# Load the dataset into a pandas DataFrame
penguins = pd.read_csv(url)

# Display the variable (column) names
print("Variable (column) names in the Palmer Penguins dataset:")
print(penguins.columns.tolist())
Variable (column) names in the Palmer Penguins dataset:
['species', 'island', 'bill_length_mm', 'bill_depth_mm', 'flipper_length_mm', 'body_mass_g', 'sex', 'year']
pip install plotly/home/runner/micromamba/envs/cookbook-dev/bin/python: No module named pip
Note: you may need to restart the kernel to use updated packages.
import plotlyimport pandas as pd
# GitHub URL for the CSV file (raw format)
url = "https://raw.githubusercontent.com/allisonhorst/palmerpenguins/master/inst/extdata/penguins.csv"
# Load the dataset into a pandas DataFrame
penguins = pd.read_csv(url)
# Display the variable (column) names
print("Variable (column) names in the Palmer Penguins dataset:")
print(penguins.columns.tolist())
Variable (column) names in the Palmer Penguins dataset:
['species', 'island', 'bill_length_mm', 'bill_depth_mm', 'flipper_length_mm', 'body_mass_g', 'sex', 'year']
print(penguins.head(10)) species island bill_length_mm bill_depth_mm flipper_length_mm \
0 Adelie Torgersen 39.1 18.7 181.0
1 Adelie Torgersen 39.5 17.4 186.0
2 Adelie Torgersen 40.3 18.0 195.0
3 Adelie Torgersen NaN NaN NaN
4 Adelie Torgersen 36.7 19.3 193.0
5 Adelie Torgersen 39.3 20.6 190.0
6 Adelie Torgersen 38.9 17.8 181.0
7 Adelie Torgersen 39.2 19.6 195.0
8 Adelie Torgersen 34.1 18.1 193.0
9 Adelie Torgersen 42.0 20.2 190.0
body_mass_g sex year
0 3750.0 male 2007
1 3800.0 female 2007
2 3250.0 female 2007
3 NaN NaN 2007
4 3450.0 female 2007
5 3650.0 male 2007
6 3625.0 female 2007
7 4675.0 male 2007
8 3475.0 NaN 2007
9 4250.0 NaN 2007
💡 Why This Approach Works:
Notice how we’re not just loading data—we’re immediately getting contextual insights that inform our next steps. The AI helps us understand the scope and structure before we dive deeper.
🧹 AI-Assisted Data Cleaning
🤖 How We Engage AI for Intelligent Cleaning
💬 Effective AI Prompting for Data Cleaning
Instead of: “Clean my data”
Try: “Analyze the missing data patterns and recommend a cleaning strategy that balances data retention with model performance for a penguin species classification task”
Why it works: We provide context (classification task), constraints (data retention vs performance), and specific guidance (missing data patterns).
Key Insight: The key to AI-assisted cleaning is providing domain context and analytical objectives
column_names_list = penguins.columns.tolist()
print("Column names (as a list using .tolist()):")
print(column_names_list)
Column names (as a list using .tolist()):
['species', 'island', 'bill_length_mm', 'bill_depth_mm', 'flipper_length_mm', 'body_mass_g', 'sex', 'year']
🧠 AI Cleaning Philosophy
Notice how the AI provides not just actions, but rationale for each decision. This builds trust and understanding, making the process educational rather than just automated.
🎨 AI-Enhanced Data Visualization
🤖 Engaging AI for Strategic Visualization Planning
💬 How to Ask AI for Visualization Strategy
Instead of: “Make some charts”
Try: “Given that I have a classification problem with 3 species and 4 numerical features, what visualization strategy would best reveal class separability and feature relationships?”
Result: AI provides a strategic framework rather than random charts.
import pandas as pd
import matplotlib.pyplot as plt
# Load dataset
url = "https://raw.githubusercontent.com/allisonhorst/palmerpenguins/master/inst/extdata/penguins.csv"
penguins = pd.read_csv(url)
# Drop rows with missing values in selected columns
penguins = penguins[['species', 'bill_length_mm', 'bill_depth_mm', 'flipper_length_mm', 'body_mass_g']].dropna()
# Set style
plt.style.use('seaborn-v0_8-whitegrid')
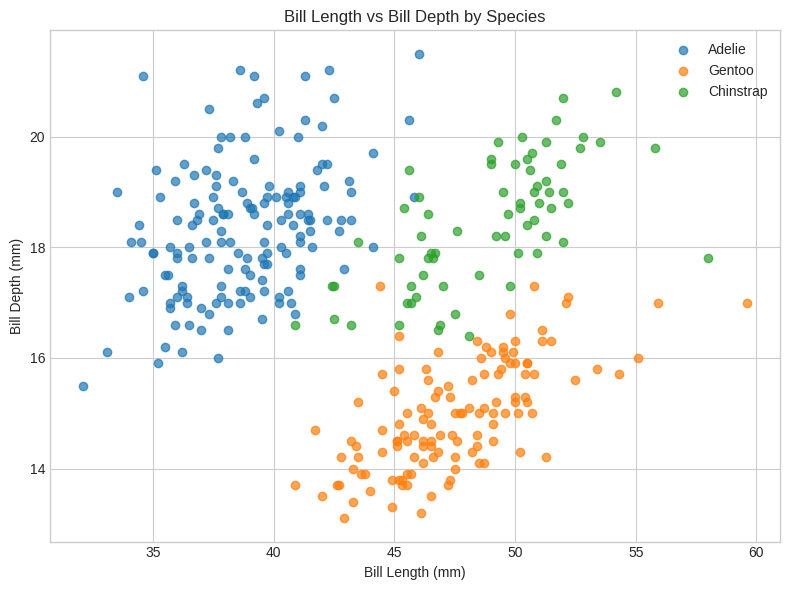
# 1. Scatter Plot: Bill Length vs Bill Depth
plt.figure(figsize=(8, 6))
for species in penguins['species'].unique():
subset = penguins[penguins['species'] == species]
plt.scatter(subset['bill_length_mm'], subset['bill_depth_mm'], label=species, alpha=0.7)
plt.xlabel("Bill Length (mm)")
plt.ylabel("Bill Depth (mm)")
plt.title("Bill Length vs Bill Depth by Species")
plt.legend()
plt.tight_layout()
plt.show()
# 2. Box Plot: Flipper Length by Species
plt.figure(figsize=(8, 6))
penguins.boxplot(column='flipper_length_mm', by='species')
plt.title("Flipper Length by Species")
plt.suptitle('')
plt.xlabel("Species")
plt.ylabel("Flipper Length (mm)")
plt.tight_layout()
plt.show()
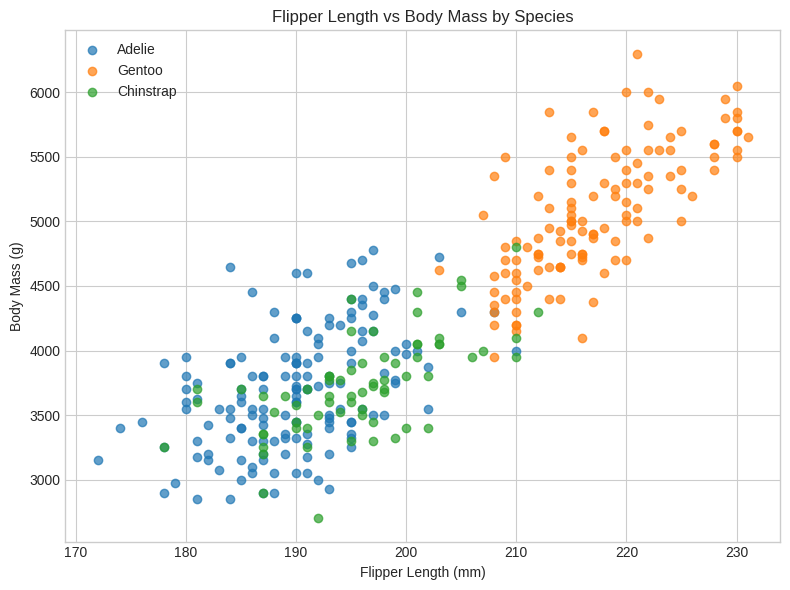
# 3. Scatter Plot: Flipper Length vs Body Mass
plt.figure(figsize=(8, 6))
for species in penguins['species'].unique():
subset = penguins[penguins['species'] == species]
plt.scatter(subset['flipper_length_mm'], subset['body_mass_g'], label=species, alpha=0.7)
plt.xlabel("Flipper Length (mm)")
plt.ylabel("Body Mass (g)")
plt.title("Flipper Length vs Body Mass by Species")
plt.legend()
plt.tight_layout()
plt.show()
<Figure size 800x600 with 0 Axes>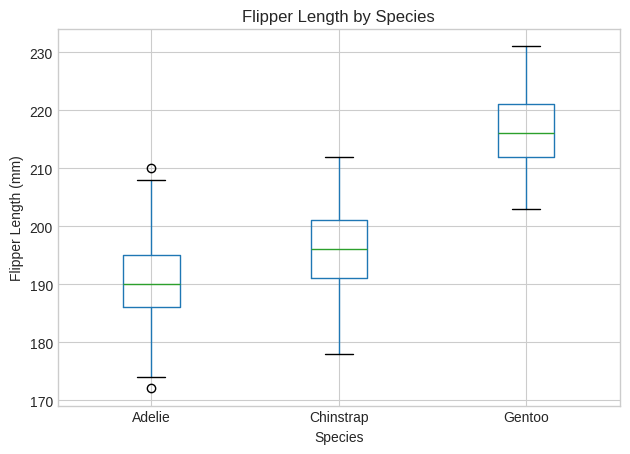
import pandas as pd
import plotly.express as px
import plotly.io as pio
import os

# --- Detect if in Jupyter Notebook ---
try:
    shell = get_ipython().__class__.__name__
    if "ZMQInteractiveShell" in shell:
        pio.renderers.default = 'notebook'  # Jupyter Notebook
    else:
        pio.renderers.default = 'iframe'    # Other notebook-like interface
except NameError:
    # Not in Jupyter (likely script or terminal)
    try:
        pio.renderers.default = 'browser'
    except:
        pio.renderers.default = 'svg'

# --- Load dataset ---
url = "https://raw.githubusercontent.com/allisonhorst/palmerpenguins/master/inst/extdata/penguins.csv"
penguins = pd.read_csv(url)

# --- Clean data ---
penguins = penguins[['species', 'bill_length_mm', 'bill_depth_mm', 'flipper_length_mm', 'body_mass_g']].dropna()

# --- Plot 1: Bill Length vs Bill Depth ---
fig1 = px.scatter(
    penguins,
    x='bill_length_mm',
    y='bill_depth_mm',
    color='species',
    title='Bill Length vs Bill Depth by Species',
    labels={'bill_length_mm': 'Bill Length (mm)', 'bill_depth_mm': 'Bill Depth (mm)'}
)

# --- Plot 2: Flipper Length by Species (Box Plot) ---
fig2 = px.box(
    penguins,
    x='species',
    y='flipper_length_mm',
    color='species',
    title='Flipper Length by Species',
    labels={'flipper_length_mm': 'Flipper Length (mm)'}
)

# --- Plot 3: Flipper Length vs Body Mass ---
fig3 = px.scatter(
    penguins,
    x='flipper_length_mm',
    y='body_mass_g',
    color='species',
    title='Flipper Length vs Body Mass by Species',
    labels={'flipper_length_mm': 'Flipper Length (mm)', 'body_mass_g': 'Body Mass (g)'}
)

# --- Show or Save Plots Based on Environment ---
try:
    # Try to show plots interactively
    fig1.show()
    fig2.show()
    fig3.show()
except:
    # If that fails (e.g., headless), save as HTML
    print("Interactive display failed. Saving plots as HTML...")
    fig1.write_html("fig1_bill_vs_depth.html")
    fig2.write_html("fig2_flipper_box.html")
    fig3.write_html("fig3_flipper_vs_mass.html")
    print("Plots saved in current directory.")
import pandas as pd
import plotly.express as px
import plotly.io as pio
from IPython.display import HTML, display

# Load and clean data
url = "https://raw.githubusercontent.com/allisonhorst/palmerpenguins/master/inst/extdata/penguins.csv"
penguins = pd.read_csv(url)
penguins = penguins[['species', 'bill_length_mm', 'bill_depth_mm']].dropna()

# Create plot
fig = px.scatter(
    penguins,
    x='bill_length_mm',
    y='bill_depth_mm',
    color='species',
    title='Bill Length vs Bill Depth by Species'
)

# Convert Plotly figure to HTML string
html_plot = pio.to_html(fig, full_html=False, include_plotlyjs='cdn')

# Display using IPython
display(HTML(html_plot))
fig.write_html("my_plot.html")
#<iframe src="my_plot.html" width="100%" height="500px"></iframe>
# 📌 Step 1: Import Libraries
import pandas as pd
import numpy as np
import matplotlib.pyplot as plt
import seaborn as sns
from sklearn.model_selection import train_test_split
from sklearn.ensemble import RandomForestClassifier
from sklearn.metrics import classification_report, confusion_matrix
from sklearn.preprocessing import LabelEncoder
# 📌 Step 2: Load Palmer Penguins Dataset
url = "https://raw.githubusercontent.com/allisonhorst/palmerpenguins/master/inst/extdata/penguins.csv"
penguins = pd.read_csv(url)

# Drop rows with missing values
penguins.dropna(inplace=True)

# Display first few rows
penguins.head()
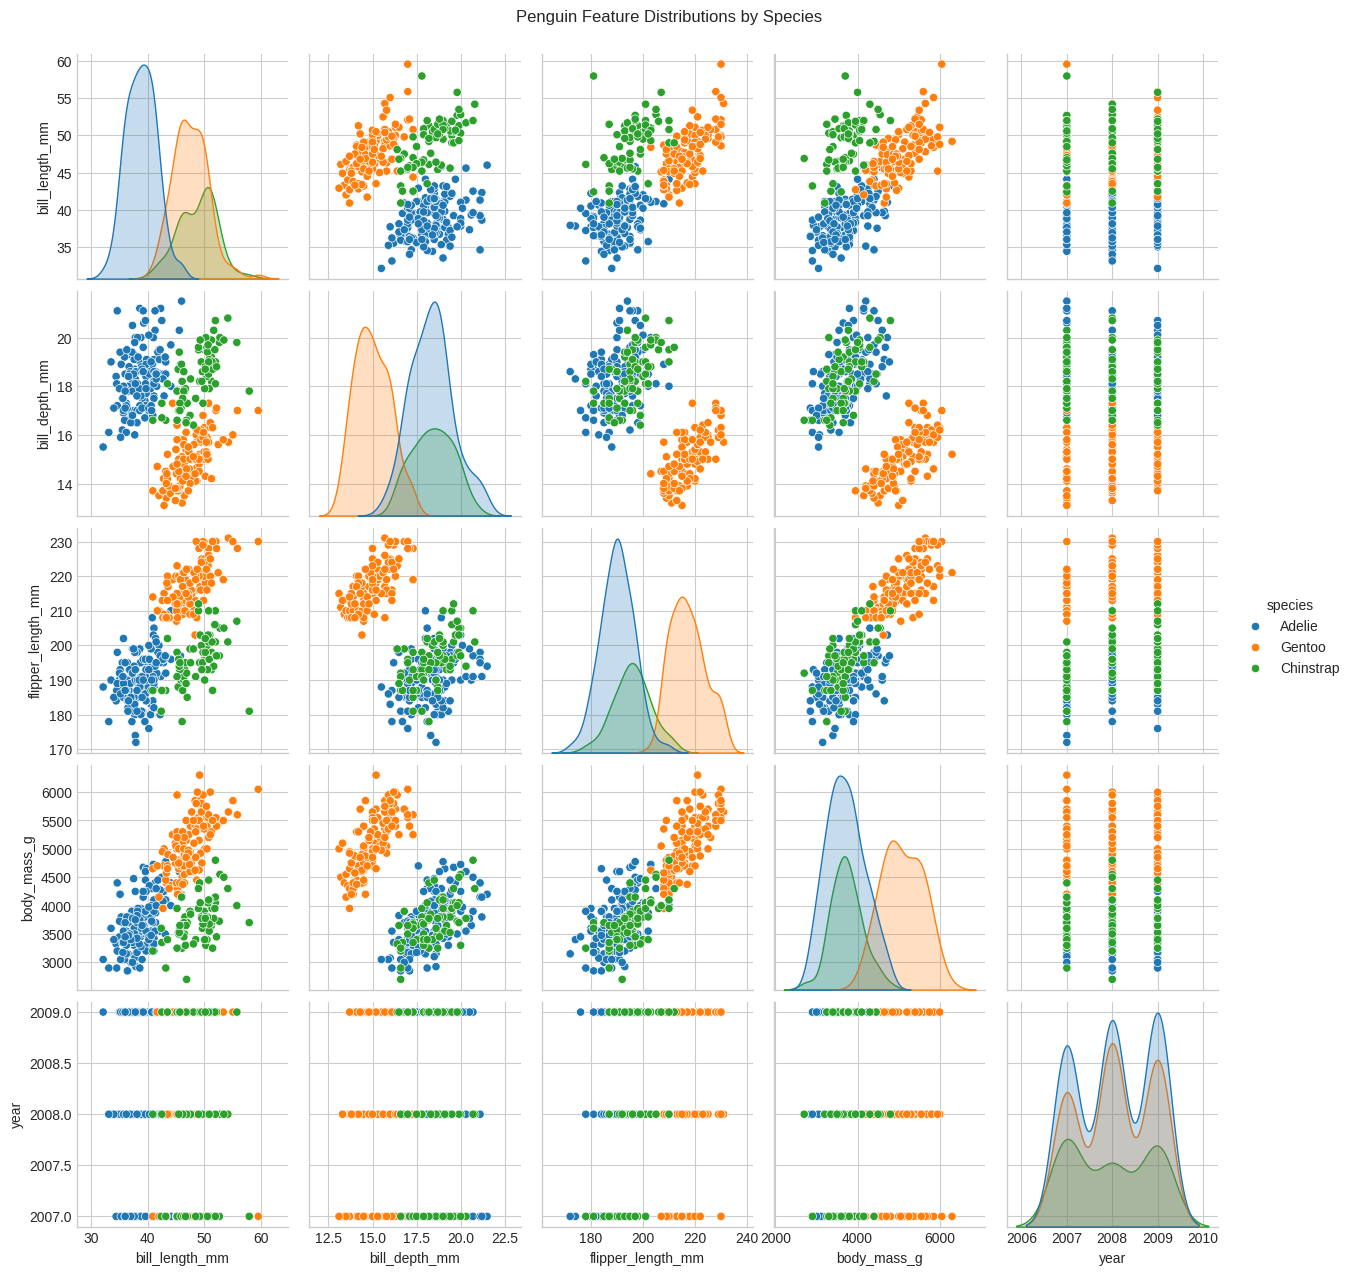
# 📌 Step 3: Exploratory Data Analysis (Optional but helpful)
sns.pairplot(penguins, hue="species")
plt.suptitle("Penguin Feature Distributions by Species", y=1.02)
plt.show()
🧠 AI Cleaning Philosophy
Notice how the AI provides not just actions, but rationale for each decision. This builds trust and understanding, making the process educational rather than just automated.
🎨 AI-Enhanced Data Visualization
🤖 Engaging AI for Strategic Visualization Planning
💬 How to Ask AI for Visualization Strategy
Instead of: “Make some charts”
Try: “Given that I have a classification problem with 3 species and 4 numerical features, what visualization strategy would best reveal class separability and feature relationships?”
Result: AI provides a strategic framework rather than random charts.
# 📌 Step 4: Preprocessing
# Encode categorical features: 'island', 'sex', and target 'species'

le_species = LabelEncoder()
penguins['species_label'] = le_species.fit_transform(penguins['species'])

le_island = LabelEncoder()
penguins['island_label'] = le_island.fit_transform(penguins['island'])

le_sex = LabelEncoder()
penguins['sex_label'] = le_sex.fit_transform(penguins['sex'])

# Define features and target
features = ['bill_length_mm', 'bill_depth_mm', 'flipper_length_mm', 'body_mass_g', 'island_label', 'sex_label']
target = 'species_label'
# 📌 Step 5: Train-Test Split
X = penguins[features]
y = penguins[target]

X_train, X_test, y_train, y_test = train_test_split(X, y, test_size=0.2, random_state=42)
# 📌 Step 6: Train Random Forest Classifier
model = RandomForestClassifier(n_estimators=100, random_state=42)
model.fit(X_train, y_train)

# Predict
y_pred = model.predict(X_test)
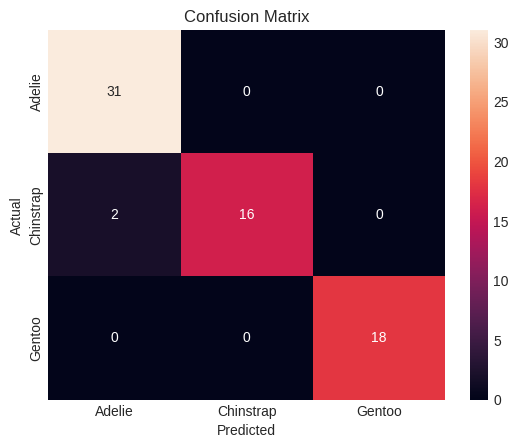
# 📌 Step 7: Evaluate Model
print("Classification Report:\n", classification_report(y_test, y_pred, target_names=le_species.classes_))

# Confusion Matrix
conf_matrix = confusion_matrix(y_test, y_pred)
sns.heatmap(conf_matrix, annot=True, fmt='d', xticklabels=le_species.classes_, yticklabels=le_species.classes_)
plt.title("Confusion Matrix")
plt.xlabel("Predicted")
plt.ylabel("Actual")
plt.show()
Classification Report:
               precision    recall  f1-score   support

      Adelie       0.94      1.00      0.97        31
   Chinstrap       1.00      0.89      0.94        18
      Gentoo       1.00      1.00      1.00        18

    accuracy                           0.97        67
   macro avg       0.98      0.96      0.97        67
weighted avg       0.97      0.97      0.97        67
🤖 AI Pattern Recognition Summary:
Clear species clustering visible in multiple feature combinations
Excellent linear separability suggests high classification accuracy potential
Flipper length vs body mass shows strongest species separation
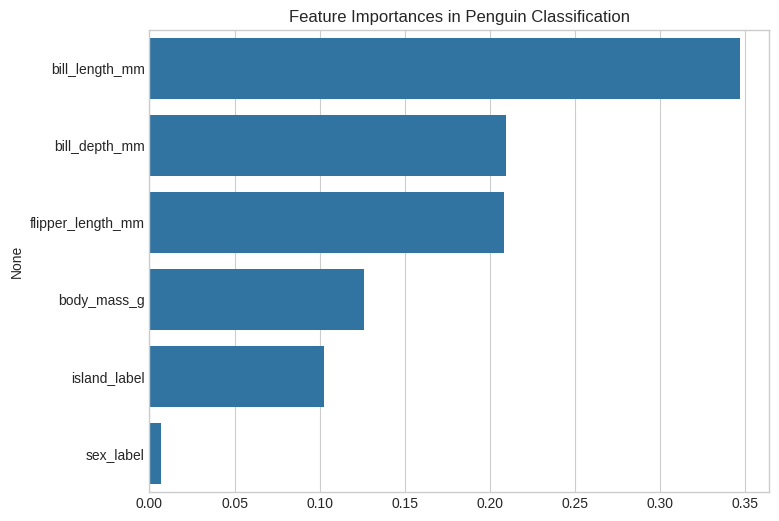
# 📌 Step 8: Feature Importance
importances = model.feature_importances_
feature_names = X.columns

plt.figure(figsize=(8, 6))
sns.barplot(x=importances, y=feature_names)
plt.title("Feature Importances in Penguin Classification")
plt.show()
🏆 Key Takeaways and Next Steps
🎯 What You’ve Accomplished
✅ Your AI Integration Achievements:
Mastered AI-enhanced data loading with immediate insights
Generated comprehensive data profiles using AI assistance
Implemented intelligent data cleaning with AI recommendations
Created strategic visualizations guided by AI analysis
Discovered key patterns that will drive successful classification
🧠 Key AI Integration Principles
🤝 Collaboration over Replacement - AI amplifies human expertise rather than replacing it
📊 Data-Driven Decisions - Let AI analyze patterns, humans interpret context
🔄 Iterative Improvement - Use AI feedback to refine your approach
📈 Scalable Methods - Develop reusable AI-assisted workflows
🎯 Goal-Oriented - Align AI assistance with business objectives
🚀 Ready Mission Assignment 3: Data Interpretation
🎖️ Achievement Unlocked!
Congratulations! You’ve completed Prediction and Machine Learning!
In the next section, you’ll learn to:
Build and train classification models with AI guidance
Optimize model performance using AI recommendations
Deploy your trained models for real-world predictions
Evaluate and interpret results with AI assistance
Note: Continue to Misison Assignment 3 to become an ‘AI Model Builder’ and continue your journey toward an AI Integration Spceialist!