Using intake-esgf with rooki
Overview
In this notebook we will demonstrate how to use intake-esgf and rooki to perform server-side operations and return the result to the user. This will occur in several steps.
We use intake-esgf to find data which is local to the ORNL server and then form an id which rooki uses to load the data remotely.
We build a rooki workflow which uses these ids (
rooki_id) to subset and average the data remotely.The results are downloaded locally and we visualize them interactively using hvplot.
Prerequisites
| Concepts | Importance | Notes |
|---|---|---|
| Intro to Intake-ESGF | Necessary | How to configure a search and use output |
| Intro to Rooki | Helpful | How to initialize and run rooki |
| Intro to hvPlot | Necessary | How to plot interactive visualizations |
Time to learn: 30 minutes
Imports
Before importing rooki, we need to set an environment variable that will signal the rooki client to use the web processing service (WPS) deployment located at Oak Ridge National Lab (ORNL).
import os

# Configuration line to set the wps node - in this case, use ORNL in the USA
url = "https://esgf-node.ornl.gov/wps"
os.environ["ROOK_URL"] = url

from rooki import operators as ops
from rooki import rooki
# Other imports
import holoviews as hv
import hvplot.xarray
import intake_esgf
import matplotlib.pyplot as plt
import panel as pn
import xarray as xr
from intake_esgf import ESGFCatalog
hv.extension("bokeh")Search and Find Data for Surface Temperature on the ORNL Node
Let’s start with refining which index we would like to search from. For this analysis, we are remotely computing on the ORNL node since this is where rooki is running. We know this from checking the ._url method of rooki!
rooki._url'https://esgf-node.ornl.gov/wps'Set the Index Node and Search
Because we are using the ORNL-based WPS, we only need information about ORNL holdings. So here we configure intake-esgf to only look at the ORNL index for data information.
intake_esgf.conf.set(indices={"anl-dev": False,
                              "ornl-dev": True})
<contextlib._GeneratorContextManager at 0x7fe3f0df5c50>Now we instantiate the catalog and perform a search for surface air temperature (tas) data from a few institution’s models. Note that we have also included specificity of the data node. The ORNL index contains information about holdings beyond the ORNL data node and so we give this to force the catalog to only return information about holdings which are local to ORNL.
cat = ESGFCatalog().search(
    experiment_id="historical",
    variable_id="tas",
    member_id="r1i1p1f1",
    table_id="Amon",
    institution_id=["MIROC", "NCAR", "NASA-GISS", "CMCC"],
)
cat.dfExtract IDs to Pass to Rooki
The catalog returns a lot of information about the datasets that were found, but the rooki WPS interface just needs an ID that looks similar to what we find in the id column of the dataframe. We need to remove the |esgf-node.ornl.gov on the end and prepend a ccs03_data. To do this we will write a function and apply it to the dataframe.
def build_rooki_id(id_list):
    rooki_id = id_list[0]
    rooki_id = rooki_id.split("|")[0]
    rooki_id = f"css03_data.{rooki_id}"  # <-- just something you have to know for now :(
    return rooki_id

rooki_ids = cat.df.id.apply(build_rooki_id).to_list()
rooki_ids
['css03_data.CMIP6.CMIP.CMCC.CMCC-CM2-HR4.historical.r1i1p1f1.Amon.tas.gn.v20200904',
'css03_data.CMIP6.CMIP.CMCC.CMCC-CM2-SR5.historical.r1i1p1f1.Amon.tas.gn.v20200616',
'css03_data.CMIP6.CMIP.CMCC.CMCC-ESM2.historical.r1i1p1f1.Amon.tas.gn.v20210114',
'css03_data.CMIP6.CMIP.MIROC.MIROC6.historical.r1i1p1f1.Amon.tas.gn.v20181212',
'css03_data.CMIP6.CMIP.NASA-GISS.GISS-E2-1-G-CC.historical.r1i1p1f1.Amon.tas.gn.v20190815',
'css03_data.CMIP6.CMIP.NASA-GISS.GISS-E2-1-G.historical.r1i1p1f1.Amon.tas.gn.v20180827',
'css03_data.CMIP6.CMIP.NASA-GISS.GISS-E2-1-H.historical.r1i1p1f1.Amon.tas.gn.v20190403',
'css03_data.CMIP6.CMIP.NASA-GISS.GISS-E2-2-G.historical.r1i1p1f1.Amon.tas.gn.v20191120',
'css03_data.CMIP6.CMIP.NASA-GISS.GISS-E2-2-H.historical.r1i1p1f1.Amon.tas.gn.v20191120',
'css03_data.CMIP6.CMIP.NCAR.CESM2-FV2.historical.r1i1p1f1.Amon.tas.gn.v20191120',
'css03_data.CMIP6.CMIP.NCAR.CESM2-WACCM-FV2.historical.r1i1p1f1.Amon.tas.gn.v20191120',
'css03_data.CMIP6.CMIP.NCAR.CESM2-WACCM.historical.r1i1p1f1.Amon.tas.gn.v20190227',
'css03_data.CMIP6.CMIP.NCAR.CESM2.historical.r1i1p1f1.Amon.tas.gn.v20190308']Compute with Rooki
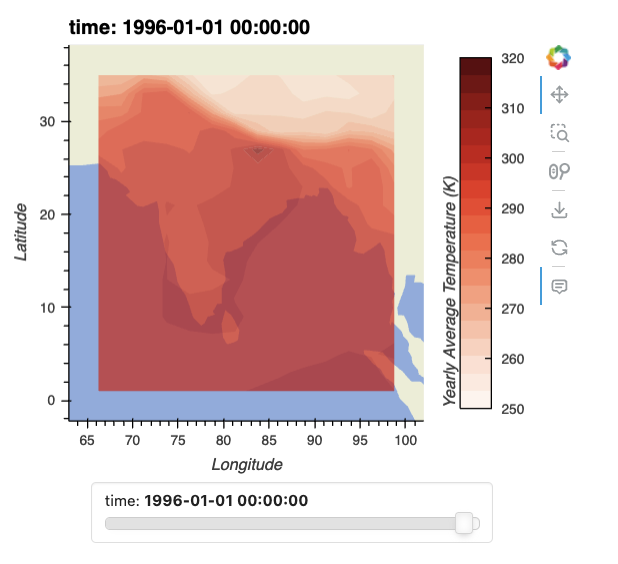
Now that we have a list of IDs to pass to rooki, let’s compute! In our case we are interested in the annual temperature from 1990-2000 over an area that includes India (latitude from 0 to 35, longitude from 65 to 100). The following function will construct a rooki workflow that uses operators (functions in the ops namespace) that rooki uses to:
read in data (
ops.Input)subset in time and space (
ops.Subset), andaverage in time (
ops.AverageByTime) on a yearly frequency.
We then check to make sure the response is okay, and if it is, return the processed dataset to the user! If something went wrong, the function will raise an error and show you the message that rooki sent back.
def india_annual_temperature(rooki_id):
    workflow = ops.AverageByTime(
        ops.Subset(
            ops.Input("tas", [rooki_id]),
            time="1990-01-01/2000-01-01",
            area="65,0,100,35",
        ),
        freq="year",
    )
    response = workflow.orchestrate()
    if not response.ok:
        raise ValueError(response)
    return response.datasets()[0]
Now let’s test a single rooki_id to demonstrate successful functionality. The rooki_id let’s the WPS know on which dataset we are intersted in operating and then the data is loaded remotely, subset, and then averaged. After this computation is finished on the server, the result is transferred to you and loaded into a xarray dataset. Inspect the dataset header to see that there are 10 times, one for each year and the latitude and longitude range spans our input values.
india_annual_temperature(rooki_ids[0])---------------------------------------------------------------------------
ValueError Traceback (most recent call last)
Cell In[8], line 1
----> 1 india_annual_temperature(rooki_ids[0])
Cell In[7], line 12, in india_annual_temperature(rooki_id)
10 response = workflow.orchestrate()
11 if not response.ok:
---> 12 raise ValueError(response)
13 return response.datasets()[0]
ValueError: Process error: No files found in given time range for css03_data.CMIP6.CMIP.CMCC.CMCC-CM2-HR4.historical.r1i1p1f1.Amon.tas.gn.v20200904Now that we have some confidence in our workflow function, we can iterate over rooki_id’s running for each and saving into a dictionary whose keys are the different models. You should see messages print to the screen which inform you where the temporary output is being downloaded. This location can be configured in rooki, but for now we will just load them into datasets.
dsd = {
    rooki_id.split(".")[4]: india_annual_temperature(rooki_id)
    for rooki_id in rooki_ids
}
Visualize the Output
Let’s use hvPlot to visualize. The datasets are stored in a dictionary of datasets, we need to:
Extract a single key
Plot a contour filled visualization, with some geographic features
tas = dsd["MIROC6"].tas
tas.hvplot.contourf(
    x="lon",
    y="lat",
    cmap="Reds",
    levels=20,
    clim=(250, 320),
    features=["land", "ocean"],
    alpha=0.7,
    widget_location="bottom",
    clabel="Yearly Average Temperature (K)",
    geo=True,
)
Summary
Within this notebook, we learned how to specify a specific index node to search from, pass discovered datasets to rooki, and chain remote-compute with several operations using rooki. We then visualized the output using hvPlot, leading to an interactive plot!
What’s next?
More adaptations of the intake-esgf + rooki to remotely compute on ESGF data.