Last Updated: 2025-07-12 02:11:50.947348
This metrics page provides an overview of user activity collected by Google Analytics across the three pillars of Project Pythia: our portal which includes information about the project as well as our resource gallery, our Foundations book, and our Cookbooks gallery. Information is either all-time (from a pre-project start date of March 2020) or year-to-date as indicated and is updated nightly to provide real-time and automated insights into our engagement, impact, and audience reach. If you would like to request a different metrics analysis, timeframe, or view, please open a GitHub issue.
Table of Total Active Users by Project
This table displays the total active users of our 3 Pythia projects over the life of Project Pythia. Google analytics defines active users as the number of unique people who have visited the site and met certain engagement requirements. You can read more from the GA4 “Understand User Metrics” documentation.
| Project | All-Time Users |
|---|---|
| Portal | 20.0K |
| Foundations | 78.6K |
| Cookbooks | 25.5K |
Chart of Active Users by Project Since Year Start
This line plot displays active users for our 3 Pythia projects (Portal in purple, Foundations in blue, and Cookbooks in salmon) since January 1st of the current year.
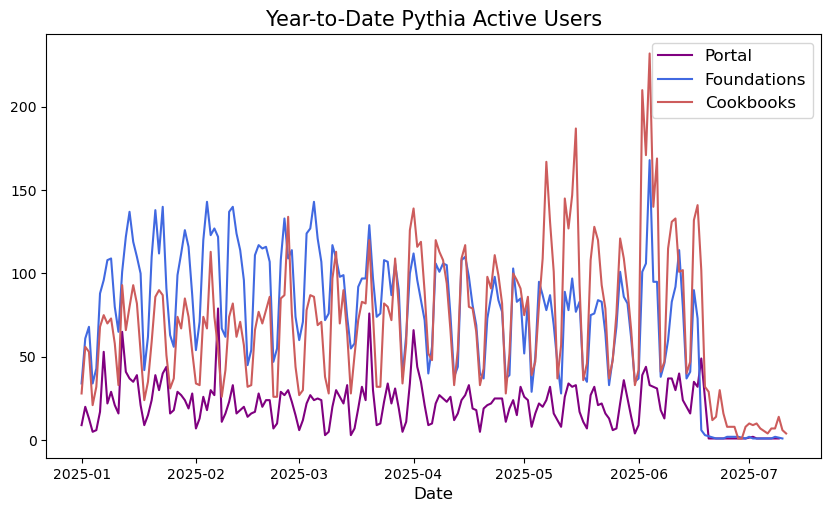
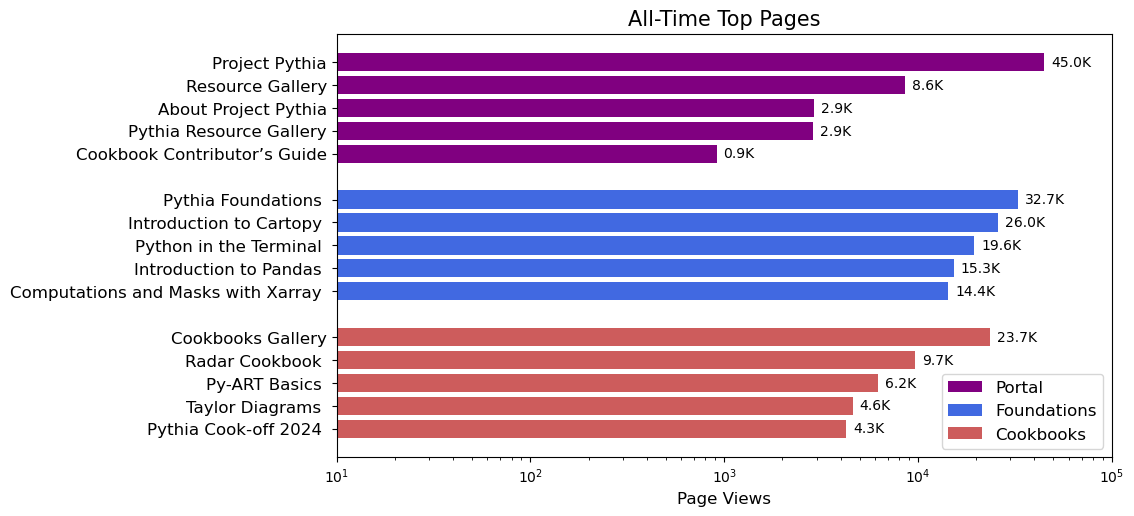
Chart of Top 5 Pages by Project
This bar-chart displays the top 5 pages by project over the life of Project Pythia, as determined by screen page views. Screen page views refers to the number of times users viewed a page, including repeated visits. To learn more visit the GA4 “API Dimensions & Metrics” page.
Map of Total Foundation Active Users by Country
This map displays the number of active users per country for Pythia Foundations for the entire life of Project Pythia.
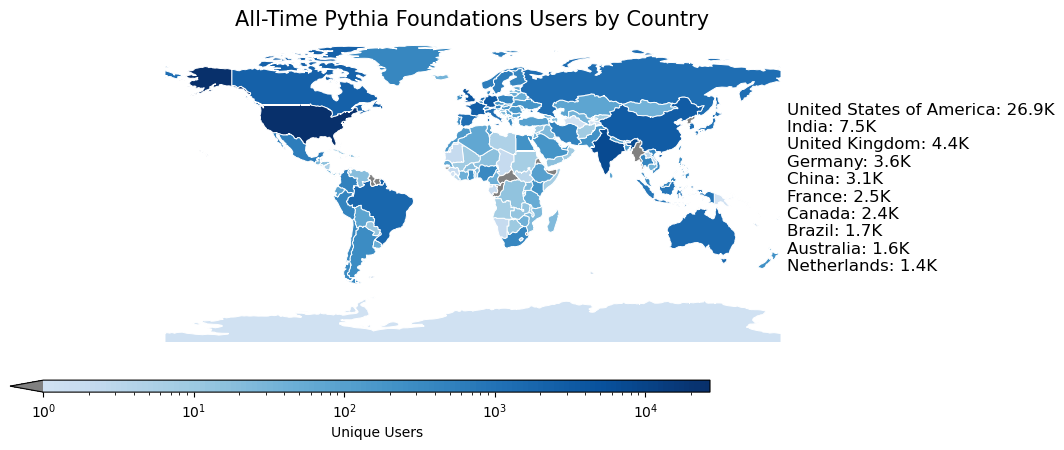
Figure 3:Map of the number of active users per country for Pythia Foundations for the entire life of Project Pythia.