Skip to article frontmatterSkip to article content

Py-ART Gridding

ARM Logo

Py-ART Gridding


Overview

Within this notebook, we will cover:

  1. What is gridding and why is it important?

  2. An overview of gridding with Py-ART

  3. How to choose a gridding routine

  4. Gridding multiple radars to the same grid

Prerequisites

ConceptsImportanceNotes
Py-ART BasicsHelpfulBasic features
Intro to CartopyHelpfulBasic features
Matplotlib BasicsHelpfulBasic plotting
NumPy BasicsHelpfulBasic arrays
  • Time to learn: 45 minutes


Imports

import os
import warnings

import cartopy.crs as ccrs
import matplotlib.pyplot as plt


import pyart
from pyart.testing import get_test_data

warnings.filterwarnings('ignore')

## You are using the Python ARM Radar Toolkit (Py-ART), an open source
## library for working with weather radar data. Py-ART is partly
## supported by the U.S. Department of Energy as part of the Atmospheric
## Radiation Measurement (ARM) Climate Research Facility, an Office of
## Science user facility.
##
## If you use this software to prepare a publication, please cite:
##
##     JJ Helmus and SM Collis, JORS 2016, doi: 10.5334/jors.119

What is gridding and why is it important?

Antenna vs. Cartesian Coordinates

Radar data, by default, is stored in a polar (or antenna) coordinate system, with the data coordinates stored as an angle (ranging from 0 to 360 degrees with 0 == North), and a radius from the radar, and an elevation which is the angle between the ground and the ground.

This format can be challenging to plot, since it is scan/radar specific. Also, it can make comparing with model data, which is on a lat/lon grid, challenging since one would need to transform the model daa cartesian coordinates to polar/antenna coordiantes.

Fortunately, PyART has a variety of gridding routines, which can be used to grid your data to a Cartesian grid. Once it is in this new grid, one can easily slice/dice the dataset, and compare to other data sources.

Why is Gridding Important?

Gridding is essential to combining multiple data sources (ex. multiple radars), and comparing to other data sources (ex. model data). There are also decisions that are made during the gridding process that have a large impact on the regridded data - for example:

  • What resolution should my grid be?

  • Which interpolation routine should I use?

  • How smooth should my interpolated data be?

While there is not always a right or wrong answer, it is important to understand the options available, and document which routine you used with your data! Also - experiment with different options and choose the best for your use case!

An overview of gridding with Py-ART

Let’s dig into the regridding process with PyART!

Read in and Visualize a Test Dataset

Let’s start with the same file used in the previous notebook (PyART Basics), which is a radar file from Northern Oklahoma.

file = get_test_data('swx_20120520_0641.nc')
radar = pyart.io.read(file)
Downloading file 'swx_20120520_0641.nc' from 'https://adc.arm.gov/pyart/example_data/swx_20120520_0641.nc' to '/home/runner/.cache/pyart-datasets'.

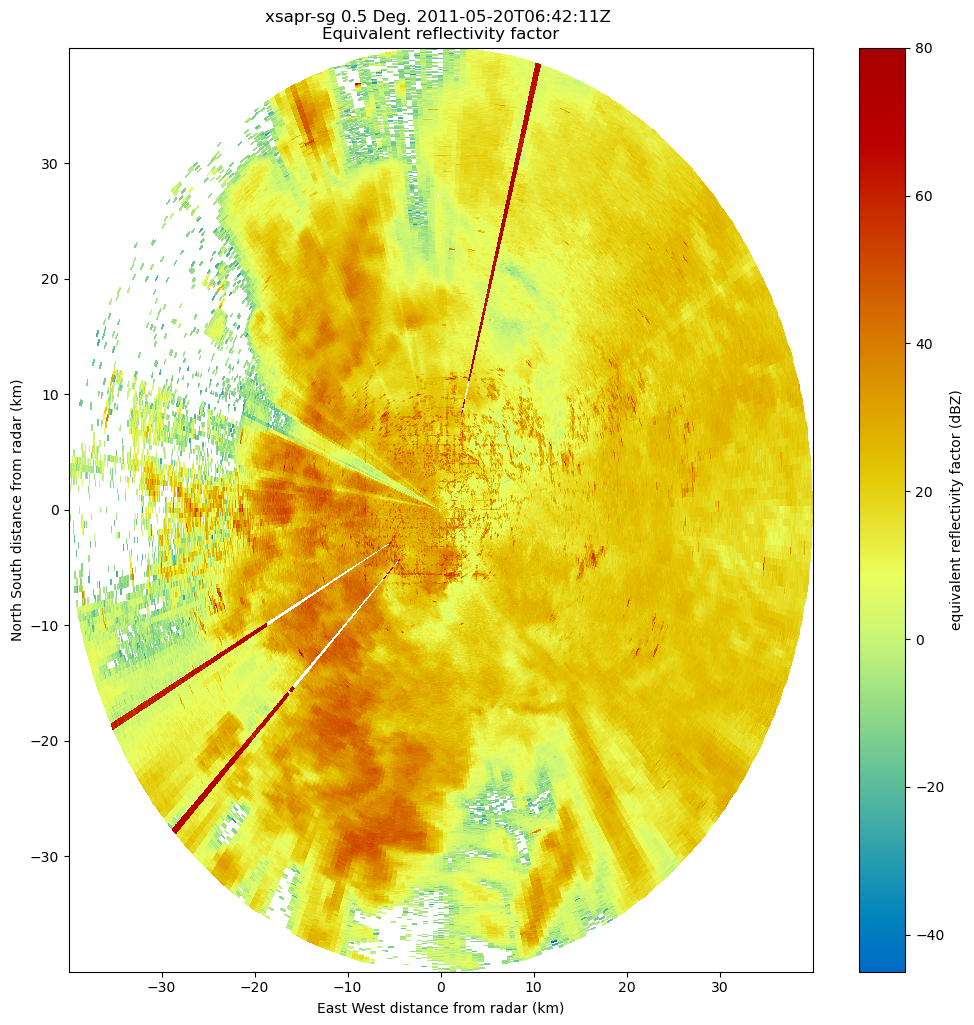
Let’s plot up quick look of reflectivity, at the lowest elevation scan (closest to the ground)

fig = plt.figure(figsize=[12, 12])
display = pyart.graph.RadarDisplay(radar)
display.plot_ppi('corrected_reflectivity_horizontal',
                 cmap='HomeyerRainbow')
<Figure size 1200x1200 with 2 Axes>

As mentioned before, the dataset is currently in the antenna coordinate system measured as distance from the radar

Setup our Gridding Routine with pyart.map.grid_from_radars()

Py-ART has the Grid object which has characteristics similar to that of the Radar object, except that the data are stored in Cartesian coordinates instead of the radar’s antenna coordinates.

pyart.core.Grid?

We can transform our data into this grid object, from the radars, using pyart.map.grid_from_radars().

Beforing gridding our data, we need to make a decision about the desired grid resolution and extent. For example, one might imagine a grid configuration of:

  • Grid extent/limits

    • 20 km in the x-direction (north/south)

    • 20 km in the y-direction (west/east)

    • 15 km in the z-direction (vertical)

  • 500 m spatial resolution

The pyart.map.grid_from_radars() function takes the grid shape and grid limits as input, with the order (z, y, x).

Let’s setup our configuration, setting our grid extent first, with the distance measured in meters

z_grid_limits = (500.,15_000.)
y_grid_limits = (-20_000.,20_000.)
x_grid_limits = (-20_000.,20_000.)

Now that we have our grid limits, we can set our desired resolution (again, in meters)

grid_resolution = 500

Let’s compute our grid shape - using the extent and resolution to compute the number of grid points in each direction.

def compute_number_of_points(extent, resolution):
    return int((extent[1] - extent[0])/resolution)

Now that we have a helper function to compute this, let’s apply it to our vertical dimension

z_grid_points = compute_number_of_points(z_grid_limits, grid_resolution)
z_grid_points
29

We can apply this to the horizontal (x, y) dimensions as well.

x_grid_points = compute_number_of_points(x_grid_limits, grid_resolution)
y_grid_points = compute_number_of_points(y_grid_limits, grid_resolution)

print(z_grid_points,
      y_grid_points,
      x_grid_points)
29 80 80

Use our configuration to grid the data!

Now that we have the grid shape and grid limits, let’s grid up our radar!

grid = pyart.map.grid_from_radars(radar,
                                  grid_shape=(z_grid_points,
                                              y_grid_points,
                                              x_grid_points),
                                  grid_limits=(z_grid_limits,
                                               y_grid_limits,
                                               x_grid_limits),
                                 )
grid
<pyart.core.grid.Grid at 0x7f304eb23e90>

We now have a pyart.core.Grid object!

Plot up the Grid Object

Plot a horizontal view of the data

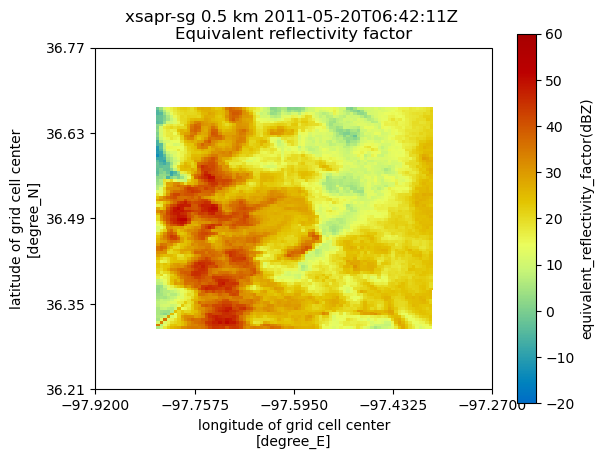
We can use the GridMapDisplay from pyart.graph to visualize our regridded data, starting with a horizontal view (slice along a single vertical level)

display = pyart.graph.GridMapDisplay(grid)
display.plot_grid('corrected_reflectivity_horizontal',
                  level=0,
                  vmin=-20,
                  vmax=60,
                  cmap='HomeyerRainbow')
Error in callback <function _draw_all_if_interactive at 0x7f3061408e00> (for post_execute), with arguments args (),kwargs {}:
---------------------------------------------------------------------------
error                                     Traceback (most recent call last)
File ~/micromamba/envs/radar-cookbook-dev/lib/python3.12/site-packages/matplotlib/pyplot.py:278, in _draw_all_if_interactive()
    276 def _draw_all_if_interactive() -> None:
    277     if matplotlib.is_interactive():
--> 278         draw_all()

File ~/micromamba/envs/radar-cookbook-dev/lib/python3.12/site-packages/matplotlib/_pylab_helpers.py:131, in Gcf.draw_all(cls, force)
    129 for manager in cls.get_all_fig_managers():
    130     if force or manager.canvas.figure.stale:
--> 131         manager.canvas.draw_idle()

File ~/micromamba/envs/radar-cookbook-dev/lib/python3.12/site-packages/matplotlib/backend_bases.py:1893, in FigureCanvasBase.draw_idle(self, *args, **kwargs)
   1891 if not self._is_idle_drawing:
   1892     with self._idle_draw_cntx():
-> 1893         self.draw(*args, **kwargs)

File ~/micromamba/envs/radar-cookbook-dev/lib/python3.12/site-packages/matplotlib/backends/backend_agg.py:382, in FigureCanvasAgg.draw(self)
    379 # Acquire a lock on the shared font cache.
    380 with (self.toolbar._wait_cursor_for_draw_cm() if self.toolbar
    381       else nullcontext()):
--> 382     self.figure.draw(self.renderer)
    383     # A GUI class may be need to update a window using this draw, so
    384     # don't forget to call the superclass.
    385     super().draw()

File ~/micromamba/envs/radar-cookbook-dev/lib/python3.12/site-packages/matplotlib/artist.py:94, in _finalize_rasterization.<locals>.draw_wrapper(artist, renderer, *args, **kwargs)
     92 @wraps(draw)
     93 def draw_wrapper(artist, renderer, *args, **kwargs):
---> 94     result = draw(artist, renderer, *args, **kwargs)
     95     if renderer._rasterizing:
     96         renderer.stop_rasterizing()

File ~/micromamba/envs/radar-cookbook-dev/lib/python3.12/site-packages/matplotlib/artist.py:71, in allow_rasterization.<locals>.draw_wrapper(artist, renderer)
     68     if artist.get_agg_filter() is not None:
     69         renderer.start_filter()
---> 71     return draw(artist, renderer)
     72 finally:
     73     if artist.get_agg_filter() is not None:

File ~/micromamba/envs/radar-cookbook-dev/lib/python3.12/site-packages/matplotlib/figure.py:3257, in Figure.draw(self, renderer)
   3254             # ValueError can occur when resizing a window.
   3256     self.patch.draw(renderer)
-> 3257     mimage._draw_list_compositing_images(
   3258         renderer, self, artists, self.suppressComposite)
   3260     renderer.close_group('figure')
   3261 finally:

File ~/micromamba/envs/radar-cookbook-dev/lib/python3.12/site-packages/matplotlib/image.py:134, in _draw_list_compositing_images(renderer, parent, artists, suppress_composite)
    132 if not_composite or not has_images:
    133     for a in artists:
--> 134         a.draw(renderer)
    135 else:
    136     # Composite any adjacent images together
    137     image_group = []

File ~/micromamba/envs/radar-cookbook-dev/lib/python3.12/site-packages/matplotlib/artist.py:71, in allow_rasterization.<locals>.draw_wrapper(artist, renderer)
     68     if artist.get_agg_filter() is not None:
     69         renderer.start_filter()
---> 71     return draw(artist, renderer)
     72 finally:
     73     if artist.get_agg_filter() is not None:

File ~/micromamba/envs/radar-cookbook-dev/lib/python3.12/site-packages/cartopy/mpl/geoaxes.py:509, in GeoAxes.draw(self, renderer, **kwargs)
    504         self.imshow(img, extent=extent, origin=origin,
    505                     transform=factory.crs, *factory_args[1:],
    506                     **factory_kwargs)
    507 self._done_img_factory = True
--> 509 return super().draw(renderer=renderer, **kwargs)

File ~/micromamba/envs/radar-cookbook-dev/lib/python3.12/site-packages/matplotlib/artist.py:71, in allow_rasterization.<locals>.draw_wrapper(artist, renderer)
     68     if artist.get_agg_filter() is not None:
     69         renderer.start_filter()
---> 71     return draw(artist, renderer)
     72 finally:
     73     if artist.get_agg_filter() is not None:

File ~/micromamba/envs/radar-cookbook-dev/lib/python3.12/site-packages/matplotlib/axes/_base.py:3226, in _AxesBase.draw(self, renderer)
   3223 if artists_rasterized:
   3224     _draw_rasterized(self.get_figure(root=True), artists_rasterized, renderer)
-> 3226 mimage._draw_list_compositing_images(
   3227     renderer, self, artists, self.get_figure(root=True).suppressComposite)
   3229 renderer.close_group('axes')
   3230 self.stale = False

File ~/micromamba/envs/radar-cookbook-dev/lib/python3.12/site-packages/matplotlib/image.py:134, in _draw_list_compositing_images(renderer, parent, artists, suppress_composite)
    132 if not_composite or not has_images:
    133     for a in artists:
--> 134         a.draw(renderer)
    135 else:
    136     # Composite any adjacent images together
    137     image_group = []

File ~/micromamba/envs/radar-cookbook-dev/lib/python3.12/site-packages/matplotlib/artist.py:71, in allow_rasterization.<locals>.draw_wrapper(artist, renderer)
     68     if artist.get_agg_filter() is not None:
     69         renderer.start_filter()
---> 71     return draw(artist, renderer)
     72 finally:
     73     if artist.get_agg_filter() is not None:

File ~/micromamba/envs/radar-cookbook-dev/lib/python3.12/site-packages/cartopy/mpl/feature_artist.py:184, in FeatureArtist.draw(self, renderer)
    179     geoms = self._feature.geometries()
    180 else:
    181     # For efficiency on local maps with high resolution features (e.g
    182     # from Natural Earth), only create paths for geometries that are
    183     # in view.
--> 184     geoms = self._feature.intersecting_geometries(extent)
    186 stylised_paths = {}
    187 # Make an empty placeholder style dictionary for when styler is not
    188 # used.  Freeze it so that we can use it as a dict key.  We will need
    189 # to unfreeze all style dicts with dict(frozen) before passing to mpl.

File ~/micromamba/envs/radar-cookbook-dev/lib/python3.12/site-packages/cartopy/feature/__init__.py:312, in NaturalEarthFeature.intersecting_geometries(self, extent)
    305 """
    306 Returns an iterator of shapely geometries that intersect with
    307 the given extent.
    308 The extent is assumed to be in the CRS of the feature.
    309 If extent is None, the method returns all geometries for this dataset.
    310 """
    311 self.scaler.scale_from_extent(extent)
--> 312 return super().intersecting_geometries(extent)

File ~/micromamba/envs/radar-cookbook-dev/lib/python3.12/site-packages/cartopy/feature/__init__.py:112, in Feature.intersecting_geometries(self, extent)
    109 if extent is not None and not np.isnan(extent[0]):
    110     extent_geom = sgeom.box(extent[0], extent[2],
    111                             extent[1], extent[3])
--> 112     return (geom for geom in self.geometries() if
    113             geom is not None and extent_geom.intersects(geom))
    114 else:
    115     return self.geometries()

File ~/micromamba/envs/radar-cookbook-dev/lib/python3.12/site-packages/cartopy/feature/__init__.py:297, in NaturalEarthFeature.geometries(self)
    295     if reader.crs is not None:
    296         self._crs = reader.crs
--> 297     geometries = tuple(reader.geometries())
    298     _NATURAL_EARTH_GEOM_CACHE[key] = geometries
    299 else:

File ~/micromamba/envs/radar-cookbook-dev/lib/python3.12/site-packages/cartopy/io/shapereader.py:173, in BasicReader.geometries(self)
    161 def geometries(self):
    162     """
    163     Return an iterator of shapely geometries from the shapefile.
    164 
   (...)    171 
    172     """
--> 173     for shape in self._reader.iterShapes(bbox=self._bbox):
    174         # Skip the shape that can not be represented as geometry.
    175         if shape.shapeType != shapefile.NULL:
    176             yield sgeom.shape(shape)

File ~/micromamba/envs/radar-cookbook-dev/lib/python3.12/site-packages/shapefile.py:2839, in Reader.iterShapes(self, bbox)
   2835 if self.numShapes:
   2836     # Iterate exactly the number of shapes from shx header
   2837     for i in range(self.numShapes):
   2838         # MAYBE: check if more left of file or exit early?
-> 2839         shape = self.__shape(oid=i, bbox=bbox)
   2840         if shape:
   2841             yield shape

File ~/micromamba/envs/radar-cookbook-dev/lib/python3.12/site-packages/shapefile.py:2717, in Reader.__shape(self, oid, bbox)
   2714 shapeType = unpack("<i", b_io.read(4))[0]
   2716 ShapeClass = SHAPE_CLASS_FROM_SHAPETYPE[shapeType]
-> 2717 shape = ShapeClass.from_byte_stream(
   2718     shapeType, b_io, recLength_bytes, oid=oid, bbox=bbox
   2719 )
   2721 # Seek to the end of this record as defined by the record header because
   2722 # the shapefile spec doesn't require the actual content to meet the header
   2723 # definition.  Probably allowed for lazy feature deletion.
   2724 # f.seek(next_shape)
   2726 return shape

File ~/micromamba/envs/radar-cookbook-dev/lib/python3.12/site-packages/shapefile.py:1210, in _CanHaveBBox.from_byte_stream(cls, shapeType, b_io, next_shape, oid, bbox)
   1204         kwargs["partTypes"] = MultiPatch._read_part_types_from_byte_stream(
   1205             b_io, nParts
   1206         )
   1208 if nPoints:
   1209     kwargs["points"] = cast(
-> 1210         PointsT, cls._read_points_from_byte_stream(b_io, nPoints)
   1211     )
   1213     if shapeType in _HasZ_shapeTypes:
   1214         kwargs["zbox"], kwargs["z"] = _HasZ._read_zs_from_byte_stream(
   1215             b_io, nPoints
   1216         )

File ~/micromamba/envs/radar-cookbook-dev/lib/python3.12/site-packages/shapefile.py:1156, in _CanHaveBBox._read_points_from_byte_stream(b_io, nPoints)
   1152 @staticmethod
   1153 def _read_points_from_byte_stream(
   1154     b_io: ReadableBinStream, nPoints: int
   1155 ) -> list[Point2D]:
-> 1156     flat = unpack(f"<{2 * nPoints}d", b_io.read(16 * nPoints))
   1157     return list(zip(*(iter(flat),) * 2))

error: unpack requires a buffer of 54224 bytes
<Figure size 640x480 with 2 Axes>

Plot a Latitudinal Slice

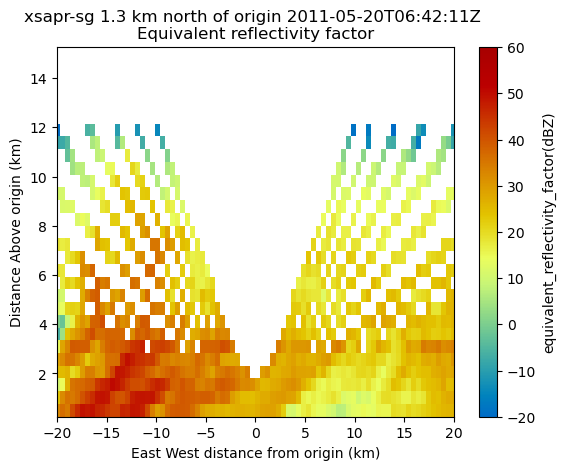
We can also slice through a single latitude or longitude!

display.plot_latitude_slice('corrected_reflectivity_horizontal',
                            lat=36.5,
                            vmin=-20,
                            vmax=60,
                            cmap='HomeyerRainbow')
plt.xlim([-20, 20]);
<Figure size 640x480 with 2 Axes>

Plot with Xarray

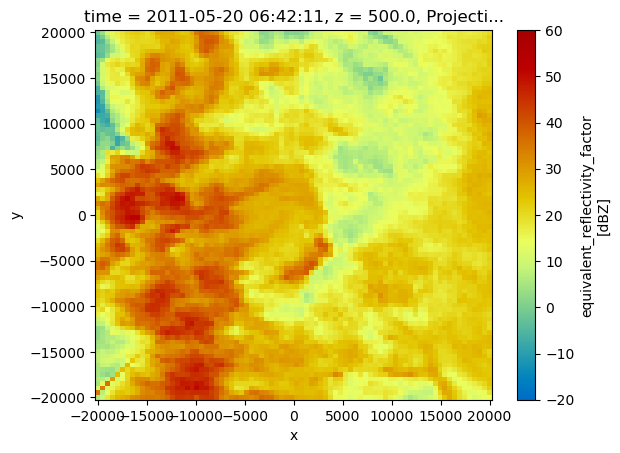
Another neat feature of the Grid object is that we can transform it to an xarray.Dataset!

ds = grid.to_xarray()
ds
Loading...

Now, our plotting routine is a one-liner, starting with the horizontal slice:

ds.isel(z=0).corrected_reflectivity_horizontal.plot(cmap='HomeyerRainbow',
                                                    vmin=-20,
                                                    vmax=60);
<Figure size 640x480 with 2 Axes>

And a vertical slice at a given y dimension (latitude)

ds.sel(y=1300,
       method='nearest').corrected_reflectivity_horizontal.plot(cmap='HomeyerRainbow',
                                                                vmin=-20,
                                                                vmax=60);
<Figure size 640x480 with 2 Axes>

Summary

Within this notebook, we covered the basics of gridding radar data using pyart, including:

  • What we mean by gridding and why is it matters

  • Configuring your gridding routine

  • Visualize gridded radar data

What’s Next

In the next few notebooks, we walk through applying data cleaning methods, and advanced visualization methods!

Resources and References

Py-ART essentials links: