Overview
This AI Assistant notebook was built by Xue “Alice” Dong, Extension Specialist at Colorado State University. It takes structured METeorological Aerodrome Report (METAR) observations from Dynamical.org, and translates them into plain-language, actionable weather guidance for non-expert users, such as farmers and ranchers. This notebook walks through querying the data, visualizing its coverage, translating a station’s observations into guidance, and demonstrating how the assistant handles missing data.
A key design principle: when data is missing or sparse, the assistant communicates that limitation honestly rather than fabricating a confident answer. This reflects responsible-AI practice for non-expert audiences.
import duckdb
import pandas as pd
from datetime import datetime, timedelta

# --- Pick a time (global snapshot: ALL stations at this hour) ---
year, month, day, hour = 2026, 1, 1, 0   # a past hour known to have data

time_1 = datetime(year, month, day, hour)
time_0 = time_1 - timedelta(hours=1)

# Build the data URLs (handles the year-boundary edge case)
YYYY_0, YYYY_1 = time_0.strftime("%Y"), time_1.strftime("%Y")
base = "https://data.source.coop/dynamical/asos-parquet"
if YYYY_0 == YYYY_1:
    URLs = [f"{base}/year={YYYY_1}/data.parquet"]
else:
    URLs = [f"{base}/year={YYYY_0}/data.parquet",
            f"{base}/year={YYYY_1}/data.parquet"]

# Query ALL stations worldwide for that hour
df = duckdb.execute("""
    SELECT valid, station, name, country, tmpf, dwpf, sknt, p01i, longitude, latitude
    FROM read_parquet($1, hive_partitioning=true)
    WHERE valid BETWEEN $2 AND $3
    ORDER BY country
""", [URLs, time_0, time_1]).fetchdf()

print(f"Retrieved {len(df)} station records for {time_1} UTC")
print(f"Countries represented: {df['country'].nunique()}")
df.head()Retrieved 7787 station records for 2026-01-01 00:00:00 UTC
Countries represented: 14
def extract_observation(df, station_code="DEN"):
    """From the global query result, pull one representative station's observation.
    Returns a dict; missing values become None so we can handle them honestly."""
    if df is None or len(df) == 0:
        return None  # no data at all

    # Filter the global dataframe down to our chosen station
    station_rows = df[df["station"] == station_code]
    if len(station_rows) == 0:
        return None  # this station not present in the data

    row = station_rows.iloc[-1]  # most recent observation for that station

    def safe(val):
        return None if pd.isna(val) else val

    return {
        "station": safe(row.get("station")),
        "name": safe(row.get("name")),
        "country": safe(row.get("country")),
        "time": str(safe(row.get("valid"))),
        "temp_f": safe(row.get("tmpf")),
        "dewpoint_f": safe(row.get("dwpf")),
        "wind_kt": safe(row.get("sknt")),
        "precip_in": safe(row.get("p01i")),
    }

# Denver as our representative station for plain-language guidance
obs = extract_observation(df, station_code="DEN")
obs
{'station': 'DEN',
'name': 'DENVER INTNL ARPT',
'country': 'US',
'time': '2025-12-31 23:53:00+00:00',
'temp_f': np.float64(57.0),
'dewpoint_f': np.float64(15.0),
'wind_kt': np.float64(4.0),
'precip_in': np.float64(0.0)}def generate_guidance_rule_based(obs):
"""Plain-language weather guidance for non-expert (e.g. agricultural) users.
Honestly flags missing data instead of guessing."""
if obs is None:
return ("No weather observations were found for this station and time. "
"I can't provide guidance without data — please try a nearby "
"station or a different time.")
where = obs["name"] or obs["station"] or "this location"
lines = [f"Weather guidance for {where} (observed {obs['time']}):", ""]
# Temperature
if obs["temp_f"] is not None:
t = obs["temp_f"]
note = ""
if t <= 32:
note = " Freezing conditions — protect sensitive crops and livestock water."
elif t >= 90:
note = " Hot — ensure livestock have shade and water; avoid midday field labor."
else:
note = " Mild conditions, generally favorable for outdoor field work."
lines.append(f"• Temperature: {t:.0f}°F.{note}")
# Wind
if obs["wind_kt"] is not None:
mph = obs["wind_kt"] * 1.15
note = " Too windy for safe spraying." if mph >= 10 else " Calm enough for spraying."
lines.append(f"• Wind: about {mph:.0f} mph.{note}")
else:
lines.append("• Wind: not reported — do not assume calm conditions before spraying.")
# Precipitation
if obs["precip_in"] is not None:
p = obs["precip_in"]
note = " Recent rainfall — fields may be wet." if p > 0 else " No recent precipitation recorded."
lines.append(f"• Precipitation (last hour): {p:.2f} in.{note}")
else:
lines.append("• Precipitation: not reported for this hour.")
lines.append("")
lines.append("Note: This guidance is based only on the available observations above. "
"Where a value is missing, no assumption has been made.")
return "\n".join(lines)
print(generate_guidance_rule_based(obs))Weather guidance for DENVER INTNL ARPT (observed 2025-12-31 23:53:00+00:00):
• Temperature: 57°F. Mild conditions, generally favorable for outdoor field work.
• Wind: about 5 mph. Calm enough for spraying.
• Precipitation (last hour): 0.00 in. No recent precipitation recorded.
Note: This guidance is based only on the available observations above. Where a value is missing, no assumption has been made.
Visualizing the Raw Observation
Before translating the data into plain language, here is what a single station’s raw observation looks like. This is the kind of numeric output that is accurate but hard for a non-expert user to act on directly.
import matplotlib.pyplot as plt

# Build a simple bar chart of the current observation's key fields
fields = []
values = []
if obs is not None:
    if obs["temp_f"] is not None:
        fields.append("Temperature (°F)"); values.append(obs["temp_f"])
    if obs["dewpoint_f"] is not None:
        fields.append("Dew point (°F)"); values.append(obs["dewpoint_f"])
    if obs["wind_kt"] is not None:
        fields.append("Wind (kt)"); values.append(obs["wind_kt"])
    if obs["precip_in"] is not None:
        fields.append("Precip (in)"); values.append(obs["precip_in"])

fig, ax = plt.subplots(figsize=(7, 4))
bars = ax.barh(fields, values, color="#3a7ca5")
ax.bar_label(bars, fmt="%.1f", padding=4)
ax.set_title(f"Observed conditions at {obs['name'] or obs['station']}", fontsize=13)
ax.set_xlabel("Value")
plt.tight_layout()
plt.show()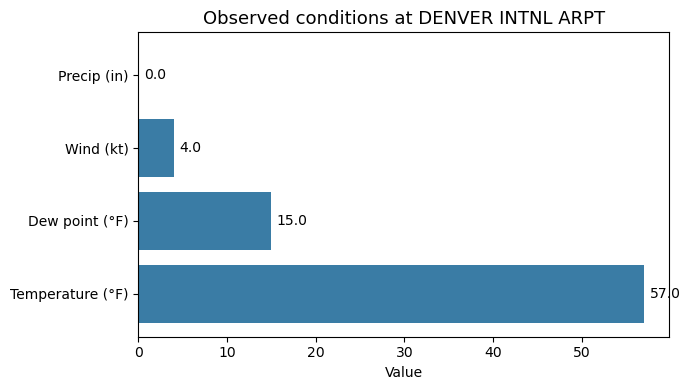
Visualizing Data Coverage: Why Honesty Matters
This global snapshot returned thousands of station records, but they come from only 14 countries. The chart below shows how many stations report from each country at this hour, revealing that vast regions of the world are simply absent from this data source. The maintainers have confirmed the current ASOS Parquet source covers only a small number of countries (just 14 in this snapshot).
This is exactly why the AI Assistant is designed to flag missing data rather than fabricate it: if a user asks about a location with no coverage, a responsible AI assistant must say so, not invent a plausible-sounding answer.
import matplotlib.pyplot as plt

# How many stations report from each country in this global snapshot?
country_counts = df["country"].value_counts()

fig, ax = plt.subplots(figsize=(8, 4.5))
bars = ax.bar(country_counts.index, country_counts.values, color="#3a7ca5")
ax.bar_label(bars, fmt="%d", padding=3, fontsize=8)
ax.set_title(f"Station coverage by country — only {df['country'].nunique()} countries "
             f"in this global snapshot", fontsize=12)
ax.set_xlabel("Country")
ax.set_ylabel("Number of stations reporting")
plt.xticks(rotation=45, ha="right")
plt.tight_layout()
plt.show()

print(f"This hour's data covers {df['country'].nunique()} countries: "
      f"{', '.join(sorted(df['country'].unique()))}")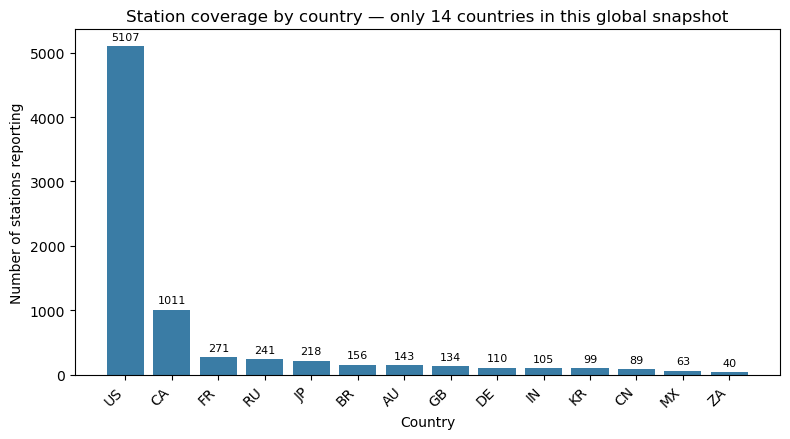
This hour's data covers 14 countries: AU, BR, CA, CN, DE, FR, GB, IN, JP, KR, MX, RU, US, ZA
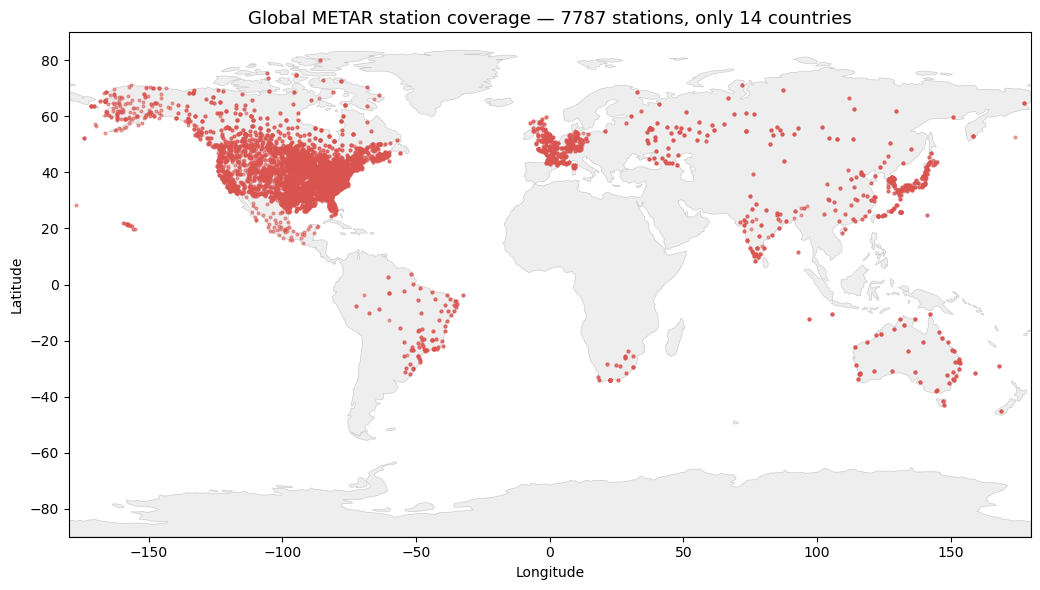
Mapping the Coverage Gap
The bar chart above counts stations per country. Plotting those same stations on a world map makes the gap unmistakable: dense clusters over North America, with vast empty regions across Africa, South America, and much of Asia. For a non-expert user asking about weather in an uncovered region, there is simply no data to answer with, which is exactly why the AI Assistant must report gaps honestly.
import matplotlib.pyplot as plt

# Plot every reporting station by its lon/lat, colored by country
fig, ax = plt.subplots(figsize=(11, 5.5))

for country, group in df.groupby("country"):
    ax.scatter(group["longitude"], group["latitude"],
               s=6, alpha=0.6, label=country)

ax.set_title(f"Global METAR station coverage — {len(df)} stations, "
             f"only {df['country'].nunique()} countries", fontsize=13)
ax.set_xlabel("Longitude")
ax.set_ylabel("Latitude")
ax.set_xlim(-180, 180)
ax.set_ylim(-90, 90)
ax.axhline(0, color="gray", lw=0.4)   # equator reference line
ax.axvline(0, color="gray", lw=0.4)   # prime meridian reference line
ax.grid(True, linewidth=0.3, alpha=0.4)
ax.legend(title="Country", bbox_to_anchor=(1.01, 1), loc="upper left",
          fontsize=7, ncol=1)
plt.tight_layout()
plt.show()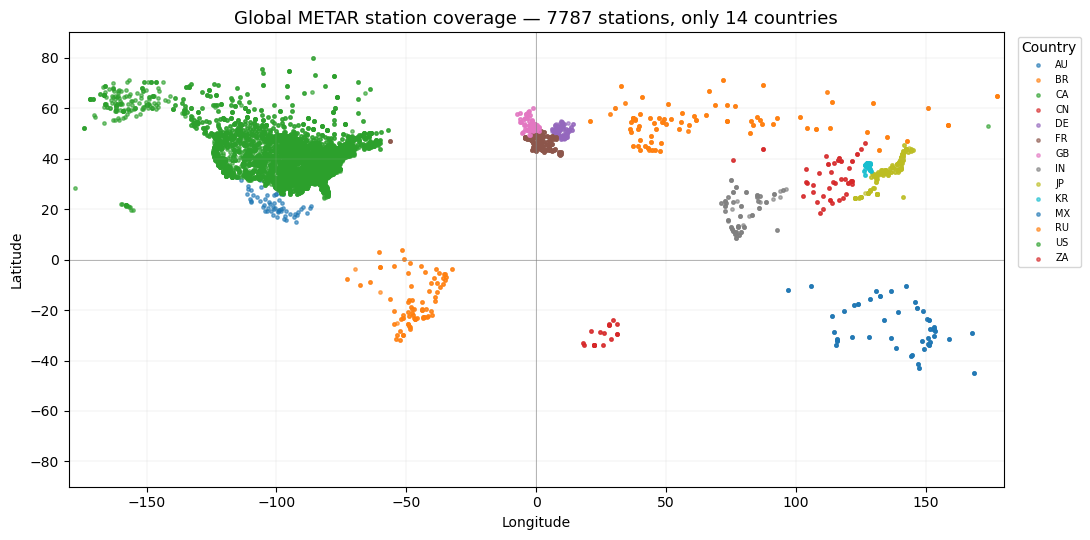
import sys, subprocess
subprocess.run([sys.executable, "-m", "pip", "install", "geodatasets", "--quiet"])
print("done")
done
import geopandas as gpd
import matplotlib.pyplot as plt
import geodatasets

# Load a world basemap via geodatasets
world = gpd.read_file(geodatasets.get_path("naturalearth.land"))

gdf = gpd.GeoDataFrame(
    df, geometry=gpd.points_from_xy(df["longitude"], df["latitude"]), crs="EPSG:4326"
)

fig, ax = plt.subplots(figsize=(12, 6))
world.plot(ax=ax, color="#eeeeee", edgecolor="#cccccc", linewidth=0.5)
gdf.plot(ax=ax, markersize=4, color="#d9534f", alpha=0.5)
ax.set_title(f"Global METAR station coverage — {len(df)} stations, "
             f"only {df['country'].nunique()} countries", fontsize=13)
ax.set_xlabel("Longitude"); ax.set_ylabel("Latitude")
ax.set_xlim(-180, 180); ax.set_ylim(-90, 90)
plt.tight_layout()
plt.show()
Downloading file 'ne_110m_land.zip' from 'https://naciscdn.org/naturalearth/110m/physical/ne_110m_land.zip' to '/home/runner/.cache/geodatasets'.
Demonstration: Honest Handling of Missing and Partial Data
A core feature of this AI Assistant is that it never fabricates values. Below, the first example shows the response when no data is available; the second shows partial data (temperature present, wind missing), where the assistant explicitly flags what it cannot confirm.
# Demonstrate honest handling of missing data:
# query a station/time unlikely to have data, and show the assistant does NOT fabricate.

obs_missing = None  # simulate "no observation found"
print(generate_guidance_rule_based(obs_missing))
print("\n" + "="*50 + "\n")

# Also show partial data: temperature present, wind missing
obs_partial = {
    "station": "TEST", "name": "Example Ranch", "country": "US",
    "time": "2026-01-01 00:00", "temp_f": 28.0,
    "dewpoint_f": None, "wind_kt": None, "precip_in": None
}
print(generate_guidance_rule_based(obs_partial))
No weather observations were found for this station and time. I can't provide guidance without data — please try a nearby station or a different time.
==================================================
Weather guidance for Example Ranch (observed 2026-01-01 00:00):
• Temperature: 28°F. Freezing conditions — protect sensitive crops and livestock water.
• Wind: not reported — do not assume calm conditions before spraying.
• Precipitation: not reported for this hour.
Note: This guidance is based only on the available observations above. Where a value is missing, no assumption has been made.
Summary and Next Step
This notebook demonstrates an AI Assistant layer that sits on top of the METAR query workflow and translates raw surface observations into plain-language, actionable guidance for non-expert users such as farmers and ranchers.
Key points:
From data to decisions. Raw fields like wind in knots or temperature in Fahrenheit are converted into practical advice (spraying conditions, frost risk, livestock considerations).
Honest handling of gaps. The AI Assistant never fabricates values. When a field is missing, it says so, important because this archive has uneven coverage. The data source covers only a small number of countries (this particular global snapshot contained just 14) and has frequent missing fields.
Reproducible and offline by design. The guidance uses a transparent rule-based approach with no external API calls, making the notebook fully reproducible in a shared environment. A future extension could pass the same structured observation to a large language model (LLM) for richer natural language, given secure credential handling.
This lowers the technical barrier to using observational weather data and shows how responsible-AI principles apply when outputs may inform real-world decisions.