
API Basics
Overview
This notebook will cover the terminology and steps needed to retrieve data from an API
Prerequisites
Motivation
API Terminology (and Status Codes)
Imports
Example: Weather API
Summary
Prerequisites
| Concepts | Importance | Notes |
|---|---|---|
| Intro to Pandas | Necessary | Familiarity with working with dataframes |
| Intro to Matplotlib | Helpful | Plotting on a data |
Motivation
There are many ways to gather data. Science and research entities like NASA are constantly producing and collecting data. As a result, attempting to collect and display live data can be difficult since new data is always being added. An API is a method to query a data source for the most current data or retrieve data from a remote source. This notebook will cover the basics regarding API usage to improve ease of access to publicly available data.
API Terminology
API: Application Programming Interface which dictacts how code can communicate and access or update remote data through methods
Request: Code sends
requeststo an API to either retrieve or update dataGET: A
GETrequest retrieves dataSET: A
SETrequest updates data
When working with public APIs, most methods will request data from an API (a GET request)
Understanding Status Codes
There are multiple possible status codes that a request will return. For the purpose of simplicity, the two most important codes are:
200 OK: The server was able to successfully process the request and return the requested data
400 Bad Request: The server was not able to process the request do to an invalid request (usally the result of an invalid URL or unknown parameters)
Imports
import requests # access API
import matplotlib.pyplot as plt
Requests
The Requests Python package is a library that manages the requests made in Python
A request returns machine-readable data in a JSON. Among the data, requests returns:
request.status_code: status code of the request (200, 400, etc...)
request.text: data requested as a JSON
request.json(): fully JSON returned by the request
Example: Weather API
The National Weather Serivce manages an API for weather in the United States. The API is hosted at https://api.weather.gov/
The first step when working with an API should be to check that the API is fuctioning by querying a general request without any additional parameters.
weather_request = requests.get("https://api.weather.gov/")
weather_request.status_code200Info
A 200 status code represents that the base API is working as expected and a query request returns no errors.
However, without any additional parameters, all the data that the request returns is just the status code.
The next step is to query with specific paramters. For the weather API the accepts either a grid around a NWS Weather Forecast Office or a specific latitude/longtiude position
The request will be formatted as:
https://api.weather.gov/points/<latitude>,<longitude>More information about the documentation can be found at NWS Weather API.
For example, the location of the NCAR Mesa Lab is 39.97777 degrees latitude and -105.274966 degrees longitude
ncar_weather = requests.get("https://api.weather.gov/points/39.97777,-105.274966")# Check request returned a valid response
ncar_weather.status_code200Success
With a valid request and paramters, this request will return data as well!
ncar_weather.json(){'@context': ['https://geojson.org/geojson-ld/geojson-context.jsonld',
{'@version': '1.1',
'wx': 'https://api.weather.gov/ontology#',
's': 'https://schema.org/',
'geo': 'http://www.opengis.net/ont/geosparql#',
'unit': 'http://codes.wmo.int/common/unit/',
'@vocab': 'https://api.weather.gov/ontology#',
'geometry': {'@id': 's:GeoCoordinates', '@type': 'geo:wktLiteral'},
'city': 's:addressLocality',
'state': 's:addressRegion',
'distance': {'@id': 's:Distance', '@type': 's:QuantitativeValue'},
'bearing': {'@type': 's:QuantitativeValue'},
'value': {'@id': 's:value'},
'unitCode': {'@id': 's:unitCode', '@type': '@id'},
'forecastOffice': {'@type': '@id'},
'forecastGridData': {'@type': '@id'},
'publicZone': {'@type': '@id'},
'county': {'@type': '@id'}}],
'id': 'https://api.weather.gov/points/39.9778,-105.275',
'type': 'Feature',
'geometry': {'type': 'Point', 'coordinates': [-105.275, 39.9778]},
'properties': {'@id': 'https://api.weather.gov/points/39.9778,-105.275',
'@type': 'wx:Point',
'cwa': 'BOU',
'type': 'land',
'forecastOffice': 'https://api.weather.gov/offices/BOU',
'gridId': 'BOU',
'gridX': 54,
'gridY': 73,
'forecast': 'https://api.weather.gov/gridpoints/BOU/54,73/forecast',
'forecastHourly': 'https://api.weather.gov/gridpoints/BOU/54,73/forecast/hourly',
'forecastGridData': 'https://api.weather.gov/gridpoints/BOU/54,73',
'observationStations': 'https://api.weather.gov/gridpoints/BOU/54,73/stations',
'relativeLocation': {'type': 'Feature',
'geometry': {'type': 'Point', 'coordinates': [-105.251251, 40.0244306]},
'properties': {'city': 'Boulder',
'state': 'CO',
'distance': {'unitCode': 'wmoUnit:m', 'value': 0},
'bearing': {'unitCode': 'wmoUnit:degree_(angle)', 'value': 0}}},
'forecastZone': 'https://api.weather.gov/zones/forecast/COZ035',
'county': 'https://api.weather.gov/zones/county/COC013',
'fireWeatherZone': 'https://api.weather.gov/zones/fire/COZ215',
'timeZone': 'America/Denver',
'radarStation': 'KFTG',
'astronomicalData': {'sunrise': '2026-07-27T05:53:54-06:00',
'sunset': '2026-07-27T20:21:23-06:00',
'transit': '2026-07-27T13:07:39-06:00',
'civilTwilightBegin': '2026-07-27T05:24:43-06:00',
'civilTwilightEnd': '2026-07-27T20:50:34-06:00',
'nauticalTwilightBegin': '2026-07-27T04:46:43-06:00',
'nauticalTwilightEnd': '2026-07-27T21:28:34-06:00',
'astronomicalTwilightBegin': '2026-07-27T04:04:35-06:00',
'astronomicalTwilightEnd': '2026-07-27T22:10:43-06:00'},
'nwr': {'transmitter': 'WXM51',
'sameCode': '008013',
'areaBroadcast': 'https://api.weather.gov/radio/WXM51/broadcast',
'pointBroadcast': 'https://api.weather.gov/points/39.9778,-105.275/radio'}}}With the latitude and longtiude of a position, the API will return information about the closest NWS forecast office that can be further queried to return the weather. A JSON acts like a Python dictionary; to return the values stored, json() can be queried for a specific key.
# JSON as Dictionary
print(type(ncar_weather.json()))
for key, value in ncar_weather.json().items():
    print(f"\nkey: {key}")
    print(f"value: {value}")
<class 'dict'>
key: @context
value: ['https://geojson.org/geojson-ld/geojson-context.jsonld', {'@version': '1.1', 'wx': 'https://api.weather.gov/ontology#', 's': 'https://schema.org/', 'geo': 'http://www.opengis.net/ont/geosparql#', 'unit': 'http://codes.wmo.int/common/unit/', '@vocab': 'https://api.weather.gov/ontology#', 'geometry': {'@id': 's:GeoCoordinates', '@type': 'geo:wktLiteral'}, 'city': 's:addressLocality', 'state': 's:addressRegion', 'distance': {'@id': 's:Distance', '@type': 's:QuantitativeValue'}, 'bearing': {'@type': 's:QuantitativeValue'}, 'value': {'@id': 's:value'}, 'unitCode': {'@id': 's:unitCode', '@type': '@id'}, 'forecastOffice': {'@type': '@id'}, 'forecastGridData': {'@type': '@id'}, 'publicZone': {'@type': '@id'}, 'county': {'@type': '@id'}}]
key: id
value: https://api.weather.gov/points/39.9778,-105.275
key: type
value: Feature
key: geometry
value: {'type': 'Point', 'coordinates': [-105.275, 39.9778]}
key: properties
value: {'@id': 'https://api.weather.gov/points/39.9778,-105.275', '@type': 'wx:Point', 'cwa': 'BOU', 'type': 'land', 'forecastOffice': 'https://api.weather.gov/offices/BOU', 'gridId': 'BOU', 'gridX': 54, 'gridY': 73, 'forecast': 'https://api.weather.gov/gridpoints/BOU/54,73/forecast', 'forecastHourly': 'https://api.weather.gov/gridpoints/BOU/54,73/forecast/hourly', 'forecastGridData': 'https://api.weather.gov/gridpoints/BOU/54,73', 'observationStations': 'https://api.weather.gov/gridpoints/BOU/54,73/stations', 'relativeLocation': {'type': 'Feature', 'geometry': {'type': 'Point', 'coordinates': [-105.251251, 40.0244306]}, 'properties': {'city': 'Boulder', 'state': 'CO', 'distance': {'unitCode': 'wmoUnit:m', 'value': 0}, 'bearing': {'unitCode': 'wmoUnit:degree_(angle)', 'value': 0}}}, 'forecastZone': 'https://api.weather.gov/zones/forecast/COZ035', 'county': 'https://api.weather.gov/zones/county/COC013', 'fireWeatherZone': 'https://api.weather.gov/zones/fire/COZ215', 'timeZone': 'America/Denver', 'radarStation': 'KFTG', 'astronomicalData': {'sunrise': '2026-07-27T05:53:54-06:00', 'sunset': '2026-07-27T20:21:23-06:00', 'transit': '2026-07-27T13:07:39-06:00', 'civilTwilightBegin': '2026-07-27T05:24:43-06:00', 'civilTwilightEnd': '2026-07-27T20:50:34-06:00', 'nauticalTwilightBegin': '2026-07-27T04:46:43-06:00', 'nauticalTwilightEnd': '2026-07-27T21:28:34-06:00', 'astronomicalTwilightBegin': '2026-07-27T04:04:35-06:00', 'astronomicalTwilightEnd': '2026-07-27T22:10:43-06:00'}, 'nwr': {'transmitter': 'WXM51', 'sameCode': '008013', 'areaBroadcast': 'https://api.weather.gov/radio/WXM51/broadcast', 'pointBroadcast': 'https://api.weather.gov/points/39.9778,-105.275/radio'}}
The closest forecast office from the NCAR Mesa Lab is forecastOffice
ncar_weather.json()["properties"]["forecastOffice"]'https://api.weather.gov/offices/BOU'The query also return the hourly forecast as a further URL to query as a request under forecastHourly
ncar_forecast_url = ncar_weather.json()["properties"]["forecastHourly"]
ncar_forecast_url'https://api.weather.gov/gridpoints/BOU/54,73/forecast/hourly'ncar_forecast_hourly = requests.get(ncar_forecast_url)
ncar_forecast_hourly.status_code200Note
There is a lot more data returned from this request! The forecast information can be collected under properties and period. Each period of time has various weather values to chose from:
ncar_forecast_hourly.json()["properties"]["periods"][0].keys()dict_keys(['number', 'name', 'startTime', 'endTime', 'isDaytime', 'temperature', 'temperatureUnit', 'temperatureTrend', 'probabilityOfPrecipitation', 'dewpoint', 'relativeHumidity', 'windSpeed', 'windDirection', 'icon', 'shortForecast', 'detailedForecast'])To plot, let’s collect the startTime, endTime and temperature (° F) values
datetime_start = ncar_forecast_hourly.json()["properties"]["periods"][0]["startTime"]
datetime_end = ncar_forecast_hourly.json()["properties"]["periods"][-1]["endTime"]
print(datetime_start)
print(datetime_end)
2026-07-26T19:00:00-06:00
2026-08-02T07:00:00-06:00
# Temperatures every hour
hour_x = []
temperature = []
for period in ncar_forecast_hourly.json()["properties"]["periods"]:
    hour_x.append(period["startTime"])
    temperature.append(period["temperature"]) # collection of temperatures
print(temperature)
[92, 87, 86, 85, 85, 83, 81, 83, 79, 78, 78, 76, 79, 82, 84, 88, 90, 90, 90, 91, 88, 88, 87, 83, 83, 80, 79, 78, 78, 77, 75, 75, 73, 71, 71, 68, 72, 74, 76, 79, 83, 85, 86, 85, 84, 84, 83, 82, 80, 78, 76, 75, 75, 75, 74, 72, 71, 69, 67, 67, 69, 72, 76, 81, 85, 88, 88, 86, 84, 83, 83, 83, 81, 79, 77, 76, 75, 74, 73, 72, 71, 70, 69, 69, 71, 75, 79, 82, 85, 87, 89, 90, 90, 90, 89, 87, 85, 82, 79, 77, 76, 75, 74, 72, 71, 69, 68, 68, 71, 75, 79, 82, 85, 87, 89, 90, 91, 91, 91, 89, 86, 83, 80, 78, 76, 75, 73, 71, 70, 68, 68, 68, 70, 74, 78, 81, 84, 87, 89, 91, 92, 93, 92, 91, 88, 84, 81, 79, 77, 76, 74, 72, 71, 69, 68, 69]
# Plot
fig, ax = plt.subplots(figsize=(22, 10))

# Plot Hourly Temperature
plt.bar(hour_x, temperature, color="dodgerblue")

# Setup Axis Limits and Title/Labels
plt.title(f"Hourly Tempearture at NCAR Mesa Lab for the Next {len(temperature)/24} Days")
plt.xlabel("Datetime")
plt.xticks(rotation=90, fontsize=8)
plt.ylabel("Temperature (\u00B0F)")
plt.show()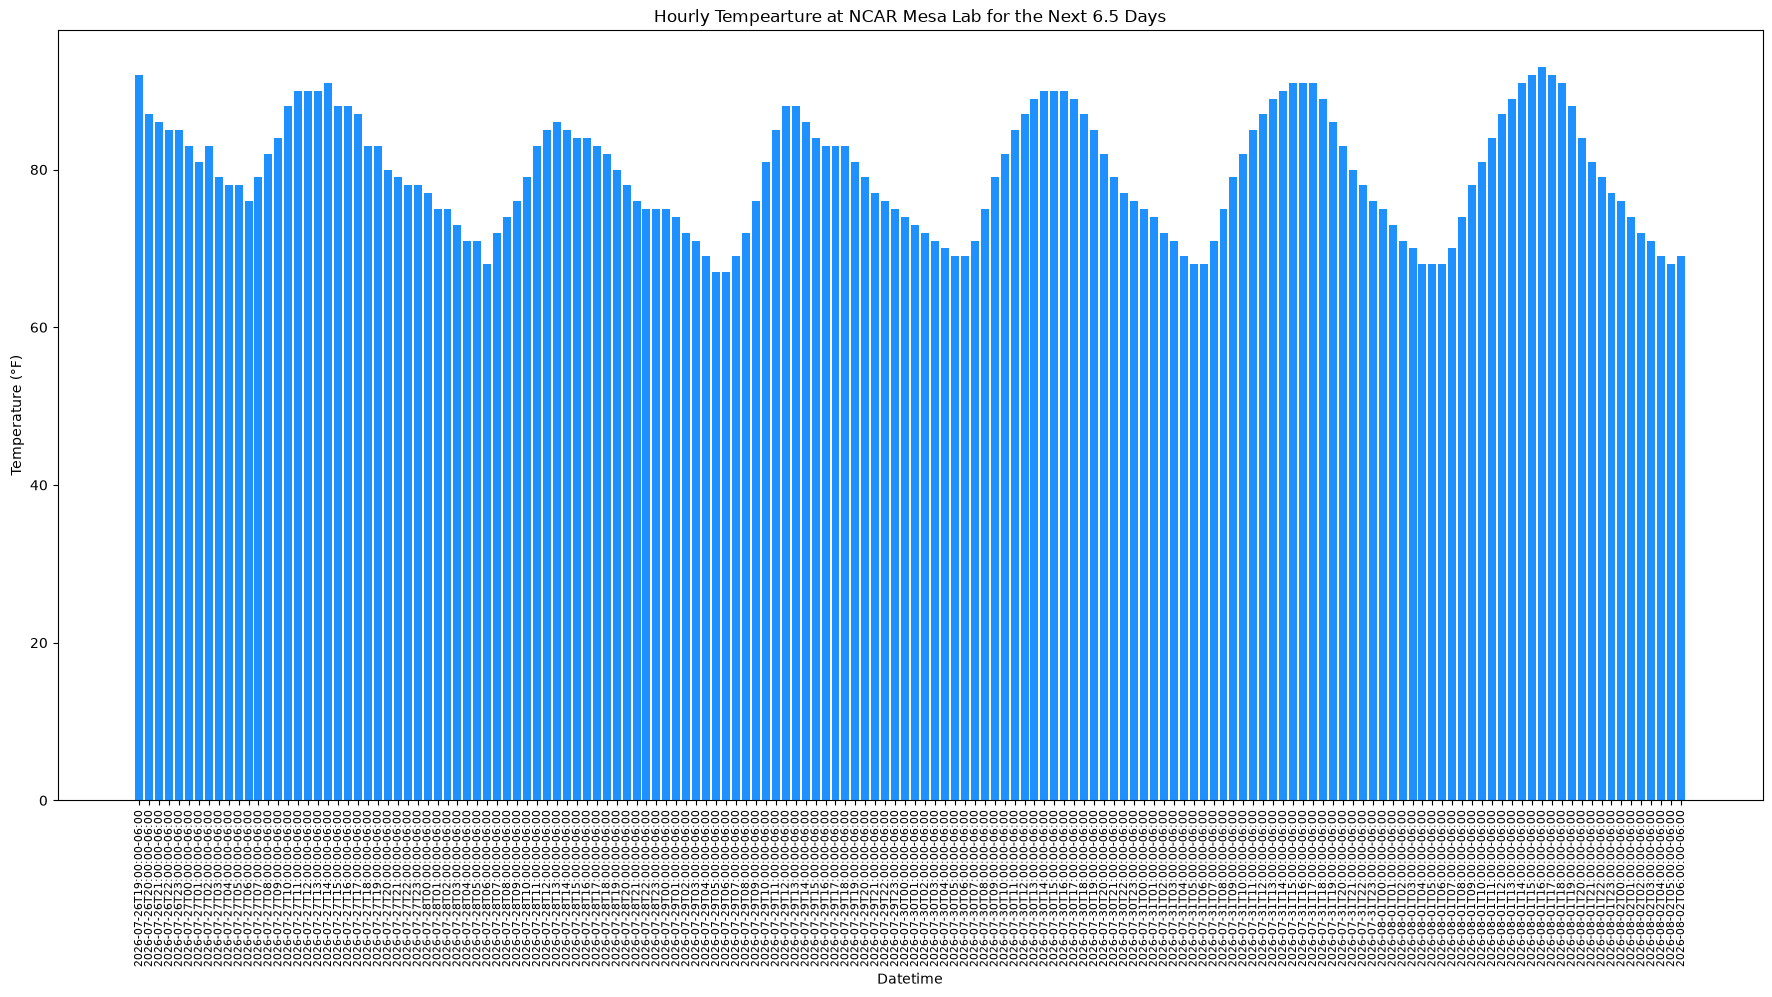
Success
We have ploted the forecasted hourly temperatures for next week!
Summary
In this notebook, we have...
covered basics about API terminology
gone through a practice example of requesting data from the National Weather Service API
generated a plot of forecasted temperatures
What’s next?
Now we can continue investigating other APIs using some example workflows in this cookbook.