Surface albedo measurements
import act
import numpy as np
import xarray as xr
import matplotlib.pyplot as plt
Load surface radiation measurements
# Set your username and token
username = 'yxie'
token = '8bb157033dfd0a5'

# Set the datastream and start/enddates
datastream = 'gucsebsM1.b1'

# Event #1 at January 2, 2022
startdate1 = '2022-01-02'
enddate1 = '2022-01-07'

# Event #2 at January 25, 2022
startdate2 = '2022-01-25'
enddate2 = '2022-01-30'

# Event #3 at April 3, 2023
startdate3 = '2023-04-03'
enddate3 = '2023-04-08'

# We are looking at 5 days after the event
numdate = 6

# Use ACT to easily download the data.  Watch for the data citation!  Show some support
# for ARM's instrument experts and cite their data if you use it in a publication
result1 = act.discovery.download_arm_data(username, token, datastream, startdate1, enddate1)
result2 = act.discovery.download_arm_data(username, token, datastream, startdate2, enddate2)
result3 = act.discovery.download_arm_data(username, token, datastream, startdate3, enddate3)
[DOWNLOADING] gucsebsM1.b1.20220102.000000.cdf
[DOWNLOADING] gucsebsM1.b1.20220103.000000.cdf
[DOWNLOADING] gucsebsM1.b1.20220104.000000.cdf
[DOWNLOADING] gucsebsM1.b1.20220105.000000.cdf
[DOWNLOADING] gucsebsM1.b1.20220106.000000.cdf
[DOWNLOADING] gucsebsM1.b1.20220107.000000.cdf

If you use these data to prepare a publication, please cite:

Sullivan, R., Keeler, E., Pal, S., & Kyrouac, J. Surface Energy Balance System
(SEBS). Atmospheric Radiation Measurement (ARM) User Facility.
https://doi.org/10.5439/1984921

[DOWNLOADING] gucsebsM1.b1.20220125.000000.cdf
[DOWNLOADING] gucsebsM1.b1.20220126.000000.cdf
[DOWNLOADING] gucsebsM1.b1.20220127.000000.cdf
[DOWNLOADING] gucsebsM1.b1.20220128.000000.cdf
[DOWNLOADING] gucsebsM1.b1.20220129.000000.cdf
[DOWNLOADING] gucsebsM1.b1.20220130.000000.cdf

If you use these data to prepare a publication, please cite:

Sullivan, R., Keeler, E., Pal, S., & Kyrouac, J. Surface Energy Balance System
(SEBS). Atmospheric Radiation Measurement (ARM) User Facility.
https://doi.org/10.5439/1984921

[DOWNLOADING] gucsebsM1.b1.20230403.000000.cdf
[DOWNLOADING] gucsebsM1.b1.20230404.000000.cdf
[DOWNLOADING] gucsebsM1.b1.20230405.000000.cdf
[DOWNLOADING] gucsebsM1.b1.20230406.000000.cdf
[DOWNLOADING] gucsebsM1.b1.20230407.000000.cdf
[DOWNLOADING] gucsebsM1.b1.20230408.000000.cdf

If you use these data to prepare a publication, please cite:

Sullivan, R., Keeler, E., Pal, S., & Kyrouac, J. Surface Energy Balance System
(SEBS). Atmospheric Radiation Measurement (ARM) User Facility.
https://doi.org/10.5439/1984921
# Let's read in the data using ACT and check out the data
ds_rad1 = act.io.read_arm_netcdf(result1)
ds_rad2 = act.io.read_arm_netcdf(result2)
ds_rad3 = act.io.read_arm_netcdf(result3)
# Quality Check the data
# Remove the bad data
ds_rad1.clean.cleanup()
#ds_rad = act.qc.arm.add_dqr_to_qc(ds_rad)
ds_rad1.qcfilter.datafilter(rm_assessments=['Bad'], del_qc_var=False)
ds_rad2.clean.cleanup()
ds_rad2.qcfilter.datafilter(rm_assessments=['Bad'], del_qc_var=False)
ds_rad3.clean.cleanup()
ds_rad3.qcfilter.datafilter(rm_assessments=['Bad'], del_qc_var=False)
# check the data structure
ds_rad1
Loading...
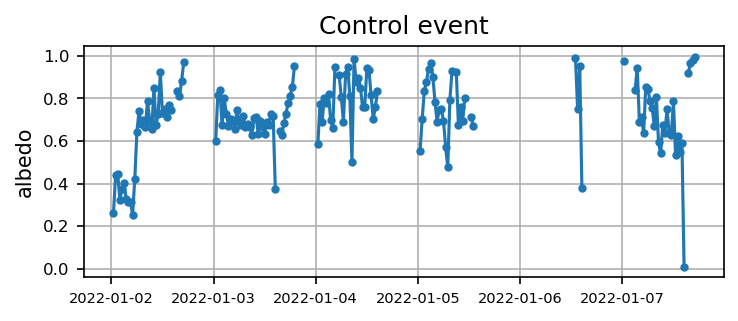
# Visualize the SEBS albedo measurement
plt.figure(figsize=(5.5,2), dpi=150)
plt.plot(ds_rad1['time'], ds_rad1['albedo'], '.-')
plt.xticks(fontsize=7)
plt.yticks(np.arange(0,1.1,0.2),fontsize=8)
plt.ylabel('albedo')
plt.grid()
plt.title('Control event')
plt.show()
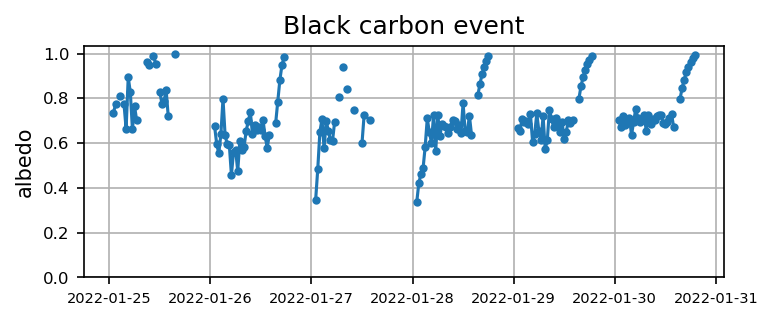
plt.figure(figsize=(5.5,2), dpi=150)
plt.plot(ds_rad2['time'], ds_rad2['albedo'], '.-')
plt.xticks(fontsize=7)
plt.yticks(np.arange(0,1.1,0.2),fontsize=8)
plt.ylabel('albedo')
plt.grid()
plt.title('Black carbon event')
plt.show()
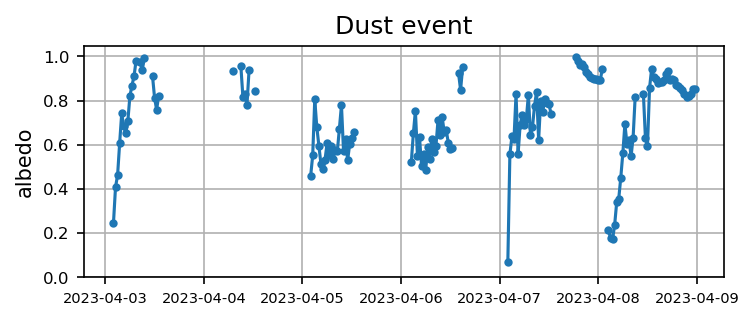
plt.figure(figsize=(5.5,2), dpi=150)
plt.plot(ds_rad3['time'], ds_rad3['albedo'], '.-')
plt.xticks(fontsize=7)
plt.yticks(np.arange(0,1.1,0.2),fontsize=8)
plt.ylabel('albedo')
plt.grid()
plt.title('Dust event')
plt.show()
Compute the daily albedo
daily_swdn1 = ds_rad1["down_short_hemisp"].groupby("time.day").mean()
daily_swup1 = ds_rad1["up_short_hemisp"].groupby("time.day").mean()
daily_alb1 = daily_swup1 / daily_swdn1

daily_swdn2 = ds_rad2["down_short_hemisp"].groupby("time.day").mean()
daily_swup2 = ds_rad2["up_short_hemisp"].groupby("time.day").mean()
daily_alb2 = daily_swup2 / daily_swdn2

daily_swdn3 = ds_rad3["down_short_hemisp"].groupby("time.day").mean()
daily_swup3 = ds_rad3["up_short_hemisp"].groupby("time.day").mean()
daily_alb3 = daily_swup3 / daily_swdn3
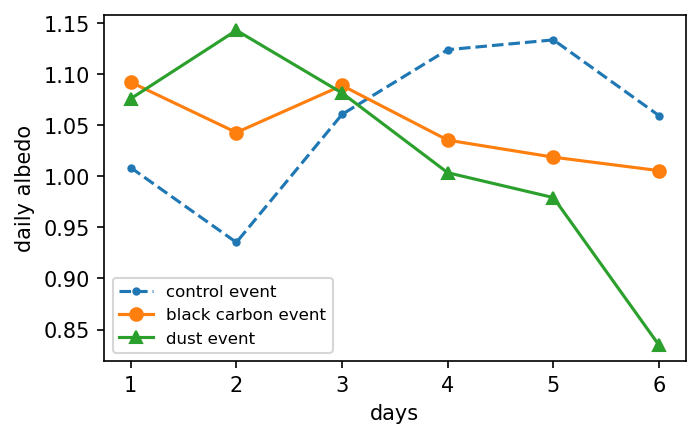
print("Control event: ")
print(daily_alb1.values)

print("Black carbon event: ")
print(daily_alb2.values)

print("Dust event: ")
print(daily_alb3.values)
Control event:
[1.0085437 0.9353342 1.0606952 1.1239946 1.1336114 1.0593574]
Black carbon event:
[1.092211 1.0429021 1.0889456 1.0354402 1.0187626 1.0055703]
Dust event:
[1.0760224 1.1429528 1.0815936 1.0035297 0.9791858 0.8345441]
plt.figure(figsize=(5,3), dpi=150)

plt.plot(np.arange(1,7), daily_alb1, '.--', label='control event')
plt.plot(np.arange(1,7), daily_alb2, 'o-', label='black carbon event')
plt.plot(np.arange(1,7), daily_alb3, '^-', label='dust event')

plt.xlabel('days')
plt.ylabel('daily albedo')
plt.legend(fontsize=8)
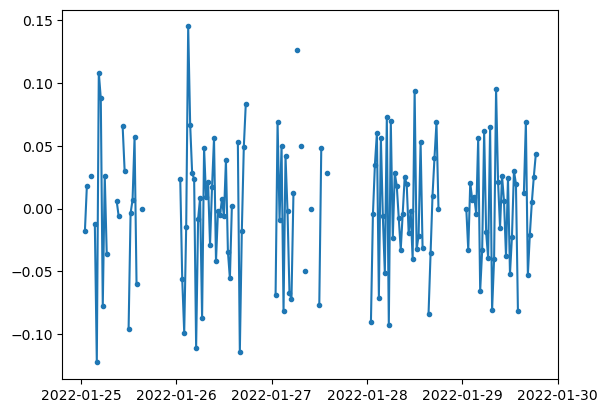
Remove the diurnal cycle
# calculate the mean by hour of each day
ds_rad["albedo"].groupby("time.hour").mean()
Loading...
# convert xarray to numpy array
albnew = ds_rad["albedo"].to_numpy()
albnew_mean = np.nanmean(np.reshape(albnew, (48, numdate)), axis=1)
/tmp/ipykernel_889/3833715621.py:2: RuntimeWarning: Mean of empty slice
albnew_mean = np.nanmean(np.reshape(albnew, (48, numdate)), axis=1)
albnew_meanarray([0.7546998 , 0.78627324, 0.7391871 , 0.9564656 , 0.9254629 ,
0.78026956, 0.9990803 , nan, nan, nan,
0.6529938 , 0.5685541 , 0.5619452 , 0.68203145, 0.6654394 ,
0.63507694, 0.8997505 , nan, nan, 0.4155189 ,
0.65742755, 0.68151975, 0.8915504 , 0.7463517 , 0.6756153 ,
nan, nan, nan, nan, 0.426916 ,
0.65423656, 0.65689987, 0.67782056, 0.684446 , 0.6697173 ,
0.89897907, 0.9886965 , nan, 0.6659013 , 0.6879279 ,
0.67221844, 0.6544498 , 0.6877172 , 0.67176163, 0.7859972 ,
0.9474498 , nan, nan], dtype=float32)# Remove the diurnal cycle from the surface albedo
alb = albnew - np.repeat(albnew_mean, numdate)
alb.shape(240,)plt.plot(ds_rad['time'], alb, '.-')