Explore WRF simulations of the surface albedo
Import modules
from datetime import timedelta

import cmweather
import xarray as xr
import xwrf
import glob

import matplotlib.pyplot as plt
from matplotlib import cm
import numpy as np
Load WRF data in January 2022 and April 2023
files_202201 = sorted(glob.glob("/data/home/yxie/wrf_data/jan_2022/*"))
files_202304 = sorted(glob.glob("/data/home/yxie/wrf_data/apr_2023/*"))
# pickd dates for each event: onset and five days after that
files_case1 = files_202201[1:7] # daily
files_case2 = files_202201[24:30] # daily
files_case3 = files_202304[8:32] # every six hours# double check the dates
files_case1['/data/home/yxie/wrf_data/jan_2022/wrfhourly_d03_2022-01-02.nc',
'/data/home/yxie/wrf_data/jan_2022/wrfhourly_d03_2022-01-03.nc',
'/data/home/yxie/wrf_data/jan_2022/wrfhourly_d03_2022-01-04.nc',
'/data/home/yxie/wrf_data/jan_2022/wrfhourly_d03_2022-01-05.nc',
'/data/home/yxie/wrf_data/jan_2022/wrfhourly_d03_2022-01-06.nc',
'/data/home/yxie/wrf_data/jan_2022/wrfhourly_d03_2022-01-07.nc']files_case2['/data/home/yxie/wrf_data/jan_2022/wrfhourly_d03_2022-01-25.nc',
'/data/home/yxie/wrf_data/jan_2022/wrfhourly_d03_2022-01-26.nc',
'/data/home/yxie/wrf_data/jan_2022/wrfhourly_d03_2022-01-27.nc',
'/data/home/yxie/wrf_data/jan_2022/wrfhourly_d03_2022-01-28.nc',
'/data/home/yxie/wrf_data/jan_2022/wrfhourly_d03_2022-01-29.nc',
'/data/home/yxie/wrf_data/jan_2022/wrfhourly_d03_2022-01-30.nc']files_case3['/data/home/yxie/wrf_data/apr_2023/wrfout_d03_2023-04-03_00:00:00',
'/data/home/yxie/wrf_data/apr_2023/wrfout_d03_2023-04-03_06:00:00',
'/data/home/yxie/wrf_data/apr_2023/wrfout_d03_2023-04-03_12:00:00',
'/data/home/yxie/wrf_data/apr_2023/wrfout_d03_2023-04-03_18:00:00',
'/data/home/yxie/wrf_data/apr_2023/wrfout_d03_2023-04-04_00:00:00',
'/data/home/yxie/wrf_data/apr_2023/wrfout_d03_2023-04-04_06:00:00',
'/data/home/yxie/wrf_data/apr_2023/wrfout_d03_2023-04-04_12:00:00',
'/data/home/yxie/wrf_data/apr_2023/wrfout_d03_2023-04-04_18:00:00',
'/data/home/yxie/wrf_data/apr_2023/wrfout_d03_2023-04-05_00:00:00',
'/data/home/yxie/wrf_data/apr_2023/wrfout_d03_2023-04-05_06:00:00',
'/data/home/yxie/wrf_data/apr_2023/wrfout_d03_2023-04-05_12:00:00',
'/data/home/yxie/wrf_data/apr_2023/wrfout_d03_2023-04-05_18:00:00',
'/data/home/yxie/wrf_data/apr_2023/wrfout_d03_2023-04-06_00:00:00',
'/data/home/yxie/wrf_data/apr_2023/wrfout_d03_2023-04-06_06:00:00',
'/data/home/yxie/wrf_data/apr_2023/wrfout_d03_2023-04-06_12:00:00',
'/data/home/yxie/wrf_data/apr_2023/wrfout_d03_2023-04-06_18:00:00',
'/data/home/yxie/wrf_data/apr_2023/wrfout_d03_2023-04-07_00:00:00',
'/data/home/yxie/wrf_data/apr_2023/wrfout_d03_2023-04-07_06:00:00',
'/data/home/yxie/wrf_data/apr_2023/wrfout_d03_2023-04-07_12:00:00',
'/data/home/yxie/wrf_data/apr_2023/wrfout_d03_2023-04-07_18:00:00',
'/data/home/yxie/wrf_data/apr_2023/wrfout_d03_2023-04-08_00:00:00',
'/data/home/yxie/wrf_data/apr_2023/wrfout_d03_2023-04-08_06:00:00',
'/data/home/yxie/wrf_data/apr_2023/wrfout_d03_2023-04-08_12:00:00',
'/data/home/yxie/wrf_data/apr_2023/wrfout_d03_2023-04-08_18:00:00']ds = xr.open_dataset(files_case1[0]).xwrf.postprocess()
#ds = xr.open_dataset(files_case1[0])
dsLoading...
Visualize the snow albedo data
ds.ALBEDOLoading...
Visualize snow albedo for the three cases
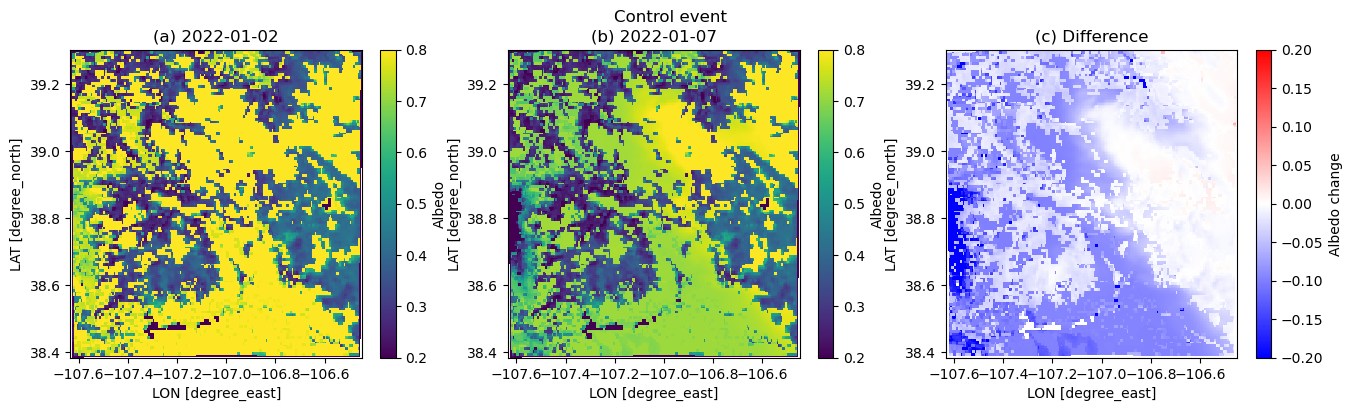
Case 1: control event - Jan 2-8, 2022
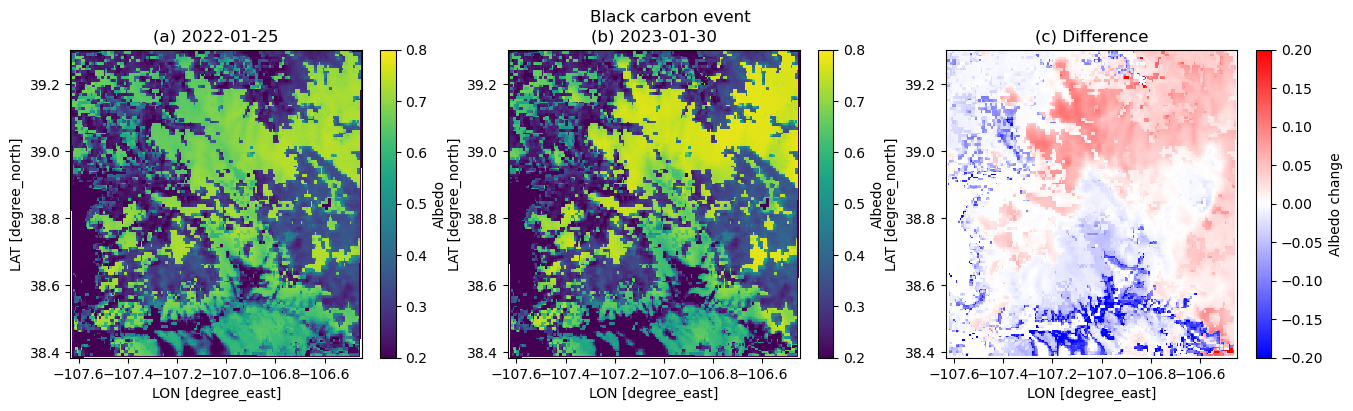
Case 2: black carbon event - Jan 25-31, 2022
Case 3: dust event - Apr 3-9, 2023
dscase1_ini = xr.open_dataset(files_case1[0]).xwrf.postprocess()
dscase1_end = xr.open_dataset(files_case1[-1]).xwrf.postprocess()

dscase2_ini = xr.open_dataset(files_case2[0]).xwrf.postprocess()
dscase2_end = xr.open_dataset(files_case2[-1]).xwrf.postprocess()

# choose 18 PM UTC, which corresponds to 12 PM in local time
dscase3_ini = xr.open_dataset(files_case3[3]).xwrf.postprocess()
dscase3_end = xr.open_dataset(files_case3[-1]).xwrf.postprocess()
Time series of simulated snow albedo
Case 1: Control event
for itt in range(0, len(files_case1) ):
    ds = xr.open_dataset(files_case1[itt]).xwrf.postprocess()
    alb = ds.ALBEDO[:,124, 109].squeeze().values
    time = ds.Time.squeeze().values

    if itt == 0:
        alb1 = alb
        time1 = time
    else:
        alb1 = np.append(alb1, alb)
        time1 = np.append(time1, time)
Visualize the time series
plt.figure(figsize=(5.5,2),dpi=150)
plt.plot(time1, alb1,'.-')
plt.xticks(fontsize=7)
plt.yticks(np.arange(0.7,0.9,0.05),fontsize=8)
plt.ylabel('WRF albedo')
plt.grid()
plt.title('Control event')
plt.show()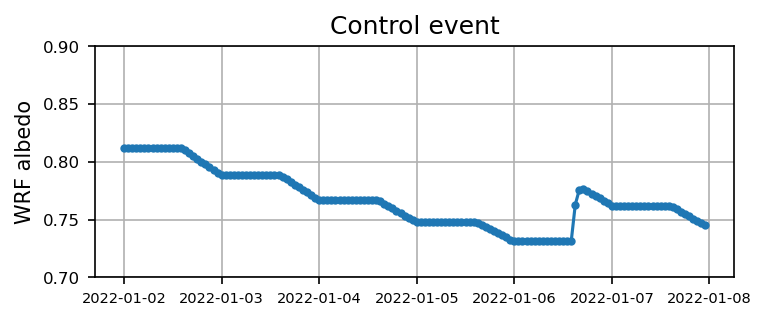
Case 2: Black carbon event
for itt in range(0, len(files_case2) ):
    ds = xr.open_dataset(files_case2[itt]).xwrf.postprocess()
    alb = ds.ALBEDO[:,124,109].squeeze().values
    time = ds.Time.squeeze().values

    if itt == 0:
        alb2 = alb
        time2 = time
    else:
        alb2 = np.append(alb2, alb)
        time2 = np.append(time2, time)
plt.figure(figsize=(5.5,2),dpi=150)
plt.plot(time2, alb2,'.-')
plt.xticks(fontsize=7)
plt.yticks(np.arange(0.6,0.8,0.05),fontsize=8)
plt.ylabel('WRF albedo')
plt.grid()
plt.title('Black carbon event')
plt.show()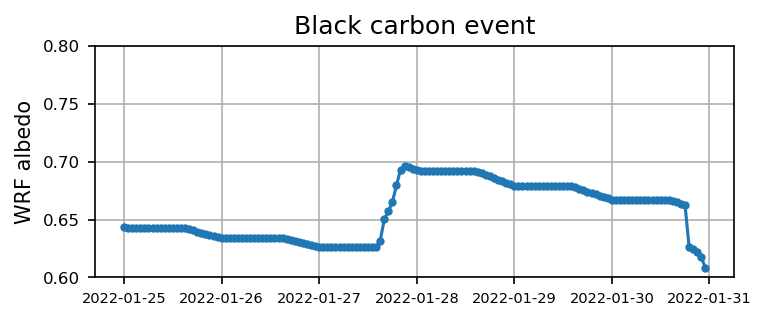
Case 3: Dust event
for itt in range(0, len(files_case3) ):
    ds = xr.open_dataset(files_case3[itt]).xwrf.postprocess()
    alb = ds.ALBEDO[:,124,109].squeeze().values
    time = ds.Time.squeeze().values

    if itt == 0:
        alb3 = alb
        time3 = time
    else:
        alb3 = np.append(alb3, alb)
        time3 = np.append(time3, time)
plt.figure(figsize=(5.5,2),dpi=150)
plt.plot(time3, alb3,'.-')
plt.xticks(fontsize=7)
plt.yticks(np.arange(0.7,0.9,0.05),fontsize=8)
plt.ylabel('WRF albedo')
plt.grid()
plt.title('Dust event')
plt.show()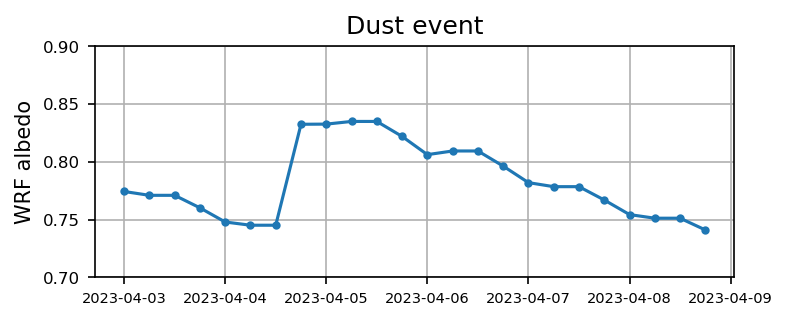
Visualize albedo time series combination
plt.figure(figsize=(5,2), dpi=150)

plt.plot(np.arange(0, alb1.size)/(alb1.size-1)*5 + 1, alb1, '--', linewidth=1, label='control event')
plt.plot(np.arange(0, alb2.size)/(alb2.size-1)*5 + 1, alb2, 'o-', markersize=2, label='black carbon event')
plt.plot(np.arange(0, alb3.size)/(alb3.size-1)*5 + 1, alb3, '^-', markersize=3, label='dust event')

plt.xlabel('days')
plt.ylabel('WRF albedo')
plt.legend(fontsize=8)
plt.yticks(np.arange(0.65, 1.00, 0.05))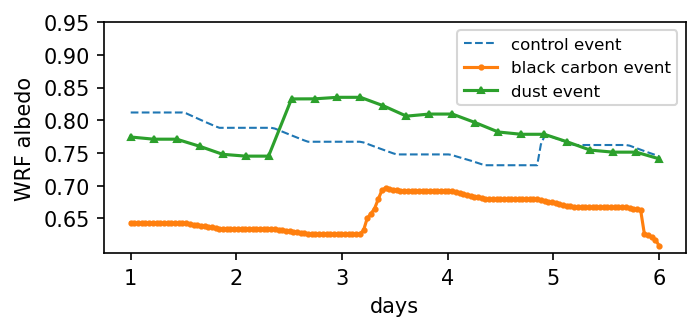
# get the longitude and latitude coordinates
xlong = dscase3_ini.XLONG.copy()
xlat = dscase3_ini.XLAT.copy()
xlong
xlatLoading...
xlong.shape(201, 201)xlat[124,109]Loading...
xlong[124,109]Loading...
dscase1_ini.ALBEDO.mean(dim=["Time"])Loading...
plt.figure(figsize=(16,4))
albini = dscase1_ini.ALBEDO[17,:,:]
albend = dscase1_end.ALBEDO[17,:,:]

plt.suptitle('Control event')

plt.subplot(1,3,1)
plt.pcolormesh(xlong, xlat, albini.squeeze(), vmin=0.2, vmax=0.8)
plt.xlabel('LON [degree_east]', fontsize=10)
plt.ylabel('LAT [degree_north]', fontsize=10)
plt.colorbar(label='Albedo')
plt.title('(a) 2022-01-02')

plt.subplot(1,3,2)
plt.pcolormesh(xlong, xlat, albend.squeeze(), vmin=0.2, vmax=0.8)
plt.xlabel('LON [degree_east]', fontsize=10)
plt.ylabel('LAT [degree_north]', fontsize=10)
plt.colorbar(label='Albedo')
plt.title('(b) 2022-01-07')

plt.subplot(1,3,3)
plt.pcolormesh(xlong, xlat, albend.squeeze() - albini.squeeze(), cmap=cm.bwr, vmin=-0.2, vmax=0.2)
plt.xlabel('LON [degree_east]', fontsize=10)
plt.ylabel('LAT [degree_north]', fontsize=10)
plt.colorbar(label='Albedo change')
plt.title('(c) Difference')
/tmp/ipykernel_3207/648137882.py:8: UserWarning: The input coordinates to pcolormesh are interpreted as cell centers, but are not monotonically increasing or decreasing. This may lead to incorrectly calculated cell edges, in which case, please supply explicit cell edges to pcolormesh.
plt.pcolormesh(xlong, xlat, albini.squeeze(), vmin=0.2, vmax=0.8)
/tmp/ipykernel_3207/648137882.py:15: UserWarning: The input coordinates to pcolormesh are interpreted as cell centers, but are not monotonically increasing or decreasing. This may lead to incorrectly calculated cell edges, in which case, please supply explicit cell edges to pcolormesh.
plt.pcolormesh(xlong, xlat, albend.squeeze(), vmin=0.2, vmax=0.8)
/tmp/ipykernel_3207/648137882.py:22: UserWarning: The input coordinates to pcolormesh are interpreted as cell centers, but are not monotonically increasing or decreasing. This may lead to incorrectly calculated cell edges, in which case, please supply explicit cell edges to pcolormesh.
plt.pcolormesh(xlong, xlat, albend.squeeze() - albini.squeeze(), cmap=cm.bwr, vmin=-0.2, vmax=0.2)
plt.figure(figsize=(16,4))
albini = dscase2_ini.ALBEDO[17,:,:]
albend = dscase2_end.ALBEDO[17,:,:]

plt.suptitle('Black carbon event')

plt.subplot(1,3,1)
plt.pcolormesh(xlong, xlat, albini.squeeze(), vmin=0.2, vmax=0.8)
plt.xlabel('LON [degree_east]', fontsize=10)
plt.ylabel('LAT [degree_north]', fontsize=10)
plt.colorbar(label='Albedo')
plt.title('(a) 2022-01-25')

plt.subplot(1,3,2)
plt.pcolormesh(xlong, xlat, albend.squeeze(), vmin=0.2, vmax=0.8)
plt.xlabel('LON [degree_east]', fontsize=10)
plt.ylabel('LAT [degree_north]', fontsize=10)
plt.colorbar(label='Albedo')
plt.title('(b) 2023-01-30')

plt.subplot(1,3,3)
plt.pcolormesh(xlong, xlat, albend.squeeze() - albini.squeeze(), cmap=cm.bwr, vmin=-0.2, vmax=0.2)
plt.xlabel('LON [degree_east]', fontsize=10)
plt.ylabel('LAT [degree_north]', fontsize=10)
plt.colorbar(label='Albedo change')
plt.title('(c) Difference')
/tmp/ipykernel_3207/78071660.py:8: UserWarning: The input coordinates to pcolormesh are interpreted as cell centers, but are not monotonically increasing or decreasing. This may lead to incorrectly calculated cell edges, in which case, please supply explicit cell edges to pcolormesh.
plt.pcolormesh(xlong, xlat, albini.squeeze(), vmin=0.2, vmax=0.8)
/tmp/ipykernel_3207/78071660.py:15: UserWarning: The input coordinates to pcolormesh are interpreted as cell centers, but are not monotonically increasing or decreasing. This may lead to incorrectly calculated cell edges, in which case, please supply explicit cell edges to pcolormesh.
plt.pcolormesh(xlong, xlat, albend.squeeze(), vmin=0.2, vmax=0.8)
/tmp/ipykernel_3207/78071660.py:22: UserWarning: The input coordinates to pcolormesh are interpreted as cell centers, but are not monotonically increasing or decreasing. This may lead to incorrectly calculated cell edges, in which case, please supply explicit cell edges to pcolormesh.
plt.pcolormesh(xlong, xlat, albend.squeeze() - albini.squeeze(), cmap=cm.bwr, vmin=-0.2, vmax=0.2)
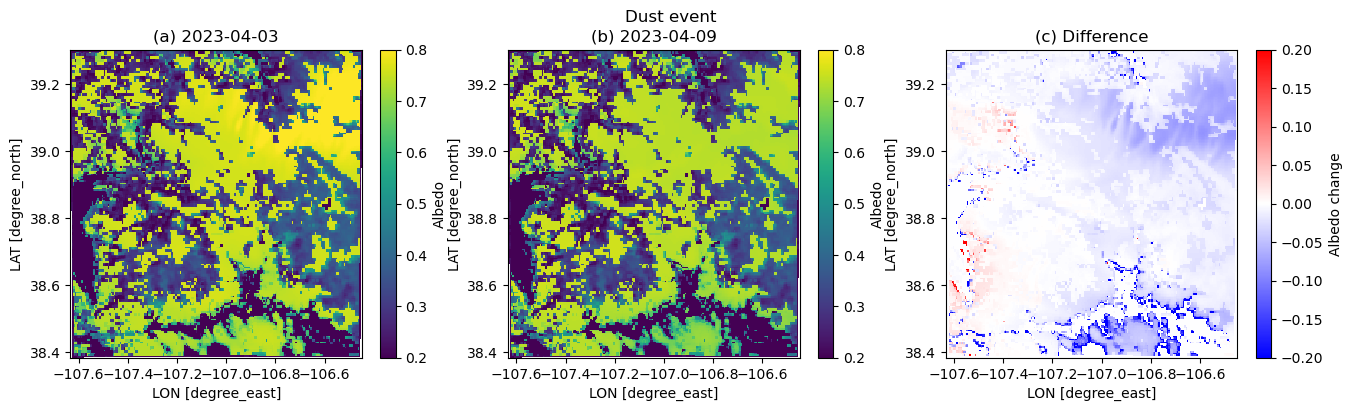
plt.figure(figsize=(16,4))

plt.suptitle('Dust event')

plt.subplot(1,3,1)
plt.pcolormesh(xlong, xlat, dscase3_ini.ALBEDO.squeeze(), vmin=0.2, vmax=0.8)
plt.xlabel('LON [degree_east]', fontsize=10)
plt.ylabel('LAT [degree_north]', fontsize=10)
plt.colorbar(label='Albedo')
plt.title('(a) 2023-04-03')

plt.subplot(1,3,2)
plt.pcolormesh(xlong, xlat, dscase3_end.ALBEDO.squeeze(), vmin=0.2, vmax=0.8)
plt.xlabel('LON [degree_east]', fontsize=10)
plt.ylabel('LAT [degree_north]', fontsize=10)
plt.colorbar(label='Albedo')
plt.title('(b) 2023-04-09')

plt.subplot(1,3,3)
plt.pcolormesh(xlong, xlat, dscase3_end.ALBEDO.squeeze() - dscase3_ini.ALBEDO.squeeze(), cmap=cm.bwr, vmin=-0.2, vmax=0.2)
plt.xlabel('LON [degree_east]', fontsize=10)
plt.ylabel('LAT [degree_north]', fontsize=10)
plt.colorbar(label='Albedo change')
plt.title('(c) Difference')
/tmp/ipykernel_3207/964711993.py:6: UserWarning: The input coordinates to pcolormesh are interpreted as cell centers, but are not monotonically increasing or decreasing. This may lead to incorrectly calculated cell edges, in which case, please supply explicit cell edges to pcolormesh.
plt.pcolormesh(xlong, xlat, dscase3_ini.ALBEDO.squeeze(), vmin=0.2, vmax=0.8)
/tmp/ipykernel_3207/964711993.py:13: UserWarning: The input coordinates to pcolormesh are interpreted as cell centers, but are not monotonically increasing or decreasing. This may lead to incorrectly calculated cell edges, in which case, please supply explicit cell edges to pcolormesh.
plt.pcolormesh(xlong, xlat, dscase3_end.ALBEDO.squeeze(), vmin=0.2, vmax=0.8)
/tmp/ipykernel_3207/964711993.py:20: UserWarning: The input coordinates to pcolormesh are interpreted as cell centers, but are not monotonically increasing or decreasing. This may lead to incorrectly calculated cell edges, in which case, please supply explicit cell edges to pcolormesh.
plt.pcolormesh(xlong, xlat, dscase3_end.ALBEDO.squeeze() - dscase3_ini.ALBEDO.squeeze(), cmap=cm.bwr, vmin=-0.2, vmax=0.2)