Overview
This notebook computes timeseries of global mean surface air temperature from a collection of CMIP6 models, spanning the historical perido as well as the SSP245 and SSP585 future scenarios. We produce a figure that shows the multi-model mean surface temperature along with its standard deviation across the model ensemble.
The data access and processing in this notebook uses similar techniques to the ECS notebook. Please refer to that notebook for details.
Prerequisites
| Concepts | Importance | Notes |
|---|---|---|
| Understanding of NetCDF | Helpful | Familiarity with metadata structure |
| Estimating Equilibrium Climate Sensitivity | Helpful | CMIP6 data access |
| Seaborn | Helpful | Plotting |
Time to learn: 10 minutes
Imports
from matplotlib import pyplot as plt
import xarray as xr
import numpy as np
import dask
from dask.diagnostics import progress
from tqdm.notebook import tqdm
import intake
import fsspec
import seaborn as sns

%matplotlib inline
col = intake.open_esm_datastore("https://storage.googleapis.com/cmip6/pangeo-cmip6.json")
col[eid for eid in col.df['experiment_id'].unique() if 'ssp' in eid]['ssp585',
'ssp245',
'ssp370SST-lowCH4',
'ssp370-lowNTCF',
'ssp370SST-lowNTCF',
'ssp370SST-ssp126Lu',
'ssp370SST',
'ssp370pdSST',
'ssp119',
'ssp370',
'esm-ssp585-ssp126Lu',
'ssp126-ssp370Lu',
'ssp370-ssp126Lu',
'ssp126',
'esm-ssp585',
'ssp245-GHG',
'ssp245-nat',
'ssp460',
'ssp434',
'ssp534-over',
'ssp245-stratO3',
'ssp245-aer',
'ssp245-cov-modgreen',
'ssp245-cov-fossil',
'ssp245-cov-strgreen',
'ssp245-covid',
'ssp585-bgc']There is currently a significant amount of data for these runs:
expts = ['historical', 'ssp245', 'ssp585']

query = dict(
    experiment_id=expts,
    table_id='Amon',
    variable_id=['tas'],
    member_id = 'r1i1p1f1',
)

col_subset = col.search(require_all_on=["source_id"], **query)
col_subset.df.groupby("source_id")[
    ["experiment_id", "variable_id", "table_id"]
].nunique()time_coder = xr.coders.CFDatetimeCoder(use_cftime=True)
def drop_all_bounds(ds):
drop_vars = [vname for vname in ds.coords
if (('_bounds') in vname ) or ('_bnds') in vname]
return ds.drop_vars(drop_vars)
def open_dset(df):
assert len(df) == 1
ds = xr.open_zarr(fsspec.get_mapper(df.zstore.values[0], token='anon'),
consolidated=True,
decode_times=time_coder)
return drop_all_bounds(ds)
def open_delayed(df):
return dask.delayed(open_dset)(df)
from collections import defaultdict
dsets = defaultdict(dict)
for group, df in col_subset.df.groupby(by=['source_id', 'experiment_id']):
dsets[group[0]][group[1]] = open_delayed(df)%%time
dsets_ = dask.compute(dict(dsets))[0]/home/runner/micromamba/envs/cmip6-cookbook-dev/lib/python3.14/site-packages/google/auth/transport/grpc.py:43: FutureWarning: grpcio < 1.83.0 does not support Post-Quantum Cryptography (PQC). Support for non-PQC environments is deprecated. In April 2027, google-auth will raise its minimum requirements to enforce grpcio >= 1.83.0. For more details on Google Cloud's post-quantum security migration, visit: https://cloud.google.com/security/resources/post-quantum-cryptography
warnings.warn(
CPU times: user 3.37 s, sys: 566 ms, total: 3.93 s
Wall time: 30.8 s
Calculate global means:
def get_lat_name(ds):
    for lat_name in ['lat', 'latitude']:
        if lat_name in ds.coords:
            return lat_name
    raise RuntimeError("Couldn't find a latitude coordinate")

def global_mean(ds):
    lat = ds[get_lat_name(ds)]
    weight = np.cos(np.deg2rad(lat))
    weight /= weight.mean()
    other_dims = set(ds.dims) - {'time'}
    return (ds * weight).mean(other_dims)
expt_da = xr.DataArray(expts, dims='experiment_id', name='experiment_id',
coords={'experiment_id': expts})
dsets_aligned = {}
for k, v in tqdm(dsets_.items()):
expt_dsets = v.values()
if any([d is None for d in expt_dsets]):
print(f"Missing experiment for {k}")
continue
for ds in expt_dsets:
ds.coords['year'] = ds.time.dt.year
# workaround for
# https://github.com/pydata/xarray/issues/2237#issuecomment-620961663
dsets_ann_mean = [v[expt].pipe(global_mean)
.swap_dims({'time': 'year'})
.drop_vars('time')
.coarsen(year=12).mean()
for expt in expts]
# align everything with the 4xCO2 experiment
dsets_aligned[k] = xr.concat(dsets_ann_mean, join='outer',
dim=expt_da)%%time
dsets_aligned_ = dask.compute(dsets_aligned)[0]CPU times: user 52.8 s, sys: 50.4 s, total: 1min 43s
Wall time: 1min 40s
source_ids = list(dsets_aligned_.keys())
source_da = xr.DataArray(source_ids, dims='source_id', name='source_id',
                         coords={'source_id': source_ids})

big_ds = xr.concat([ds.reset_coords(drop=True)
                    for ds in dsets_aligned_.values()],
                    dim=source_da)

big_ds
/tmp/ipykernel_4611/2886188115.py:5: FutureWarning: In a future version of xarray the default value for join will change from join='outer' to join='exact'. This change will result in the following ValueError: cannot be aligned with join='exact' because index/labels/sizes are not equal along these coordinates (dimensions): 'year' ('year',) The recommendation is to set join explicitly for this case.
big_ds = xr.concat([ds.reset_coords(drop=True)
df_all = big_ds.sel(year=slice(1900, 2100)).to_dataframe().reset_index()
df_all.head()sns.relplot(data=df_all,
x="year", y="tas", hue='experiment_id',
kind="line", errorbar="sd", aspect=2);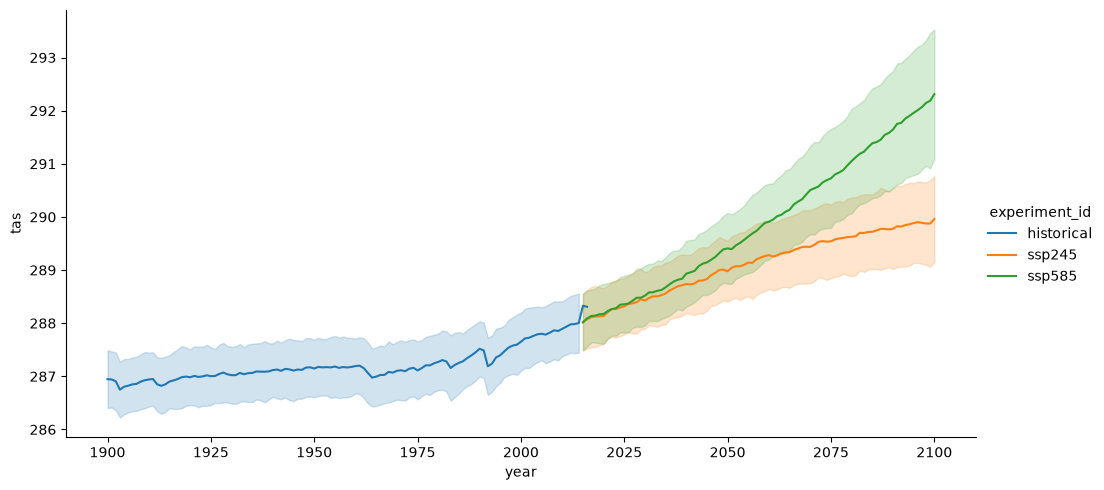
Summary
In this notebook, we accessed data for historical, SSP245, and SSP585 runs from a collection of CMIP6 models and plotted the multimodel-mean global average surface air temperature for each run.
What’s next?
We will use CMIP6 data to analyze precipitation intensity under a warming climate.
Additional resources
Original notebook in the Pangeo Gallery by Henri Drake and Ryan Abernathey