Total Column Precipitable Water (TCPW)
Calculate TCPW on a grid of netCDF data using MetPy.
import metpy.calc as mpcalc
import xarray as xr
import numpy as np
from metpy.calc import cape_cin, surface_based_cape_cin, dewpoint_from_specific_humidity, parcel_profile,relative_humidity_from_specific_humidity,most_unstable_cape_cin, precipitable_water
from metpy.units import units
import matplotlib.pyplot as plt
import cartopy.crs as ccrs
import cartopy.feature as cfeature
## opening NetCDF file using xarray

ds = xr.open_dataset("NETCDF_FILE.nc", decode_times=True)
ds
<xarray.Dataset> Size: 2MB
Dimensions:  (time: 1, lon: 71, lat: 41, lev: 23)
Coordinates:
  * time     (time) datetime64[ns] 8B 2019-06-08
  * lon      (lon) float64 568B -130.5 -129.5 -128.5 ... -62.5 -61.5 -60.5
  * lat      (lat) float64 328B 20.5 21.5 22.5 23.5 24.5 ... 57.5 58.5 59.5 60.5
  * lev      (lev) float64 184B 1e+03 975.0 950.0 925.0 ... 300.0 250.0 200.0
Data variables:
    H        (time, lev, lat, lon) float32 268kB ...
    OMEGA    (time, lev, lat, lon) float32 268kB ...
    PS       (time, lat, lon) float32 12kB ...
    QV       (time, lev, lat, lon) float32 268kB ...
    SLP      (time, lat, lon) float32 12kB ...
    T        (time, lev, lat, lon) float32 268kB ...
    U        (time, lev, lat, lon) float32 268kB ...
    V        (time, lev, lat, lon) float32 268kB ...
Attributes: (12/33)
    CDI:                               Climate Data Interface version 1.9.8 (...
    Conventions:                       CF-1
    History:                           Original file generated: Tue Jun 18 21...
    Comment:                           GMAO filename: d5124_m2_jan10.inst3_3d...
    Filename:                          MERRA2_400.inst3_3d_asm_Np.20190608.nc4
    Institution:                       NASA Global Modeling and Assimilation ...
    ...                                ...
    RangeBeginningTime:                00:00:00.000000
    RangeEndingDate:                   2019-06-08
    RangeEndingTime:                   21:00:00.000000
    history_L34RS:                     'Created by L34RS v1.4.3 @ NASA GES DI...
    CDO:                               Climate Data Operators version 1.9.8 (...
cdo_openmp_thread_number: 12#### making a function to slice the xarray dataset according to our need.
def slicer (data,lat1, lat2, lon1, lon2, time1,time2) :
sliced_data = data.sel(lat =slice(lat1, lat2), lon = slice(lon1, lon2),time = slice(time1, time2))
return sliced_data
#slicing the data for CONUS only

new_data = slicer(ds,23.5,50.5,-125.5,-66.5, ds.time[0], ds.time[0])
new_data
<xarray.Dataset> Size: 942kB
Dimensions:  (time: 1, lon: 60, lat: 28, lev: 23)
Coordinates:
  * time     (time) datetime64[ns] 8B 2019-06-08
  * lon      (lon) float64 480B -125.5 -124.5 -123.5 ... -68.5 -67.5 -66.5
  * lat      (lat) float64 224B 23.5 24.5 25.5 26.5 27.5 ... 47.5 48.5 49.5 50.5
  * lev      (lev) float64 184B 1e+03 975.0 950.0 925.0 ... 300.0 250.0 200.0
Data variables:
    H        (time, lev, lat, lon) float32 155kB ...
    OMEGA    (time, lev, lat, lon) float32 155kB ...
    PS       (time, lat, lon) float32 7kB ...
    QV       (time, lev, lat, lon) float32 155kB ...
    SLP      (time, lat, lon) float32 7kB ...
    T        (time, lev, lat, lon) float32 155kB ...
    U        (time, lev, lat, lon) float32 155kB ...
    V        (time, lev, lat, lon) float32 155kB ...
Attributes: (12/33)
    CDI:                               Climate Data Interface version 1.9.8 (...
    Conventions:                       CF-1
    History:                           Original file generated: Tue Jun 18 21...
    Comment:                           GMAO filename: d5124_m2_jan10.inst3_3d...
    Filename:                          MERRA2_400.inst3_3d_asm_Np.20190608.nc4
    Institution:                       NASA Global Modeling and Assimilation ...
    ...                                ...
    RangeBeginningTime:                00:00:00.000000
    RangeEndingDate:                   2019-06-08
    RangeEndingTime:                   21:00:00.000000
    history_L34RS:                     'Created by L34RS v1.4.3 @ NASA GES DI...
    CDO:                               Climate Data Operators version 1.9.8 (...
cdo_openmp_thread_number: 12##extracting temperature, pressure and specific humidity from the dataset
p =new_data.lev*units('hPa')
T = new_data.T
sh = new_data.QV*units('dimensionless')
TCPW = np.zeros((1, 28, 60),dtype=float)
###calculating TCPW in multidimension
for h in range (len(new_data.time)):
for i in range (len(new_data.lat)):
for j in range(len(new_data.lon)):
TC = (T[h,:,i,j]-(273.15))*units('degC')
Td = dewpoint_from_specific_humidity(np.array(p)*units('hPa'),TC, sh[h,:,i,j])
TPW_S = precipitable_water(np.array(p)*units('hPa'), np.array(Td)*units('degC'))
TCPW[h,i,j] = TPW_S.magnitude
TCPW
array([[[22.34989166, 22.14568471, 21.66339844, ..., 49.19934755,
         48.19983052, 47.56431138],
        [21.7082633 , 21.17000119, 20.13788047, ..., 45.64615776,
         45.32941988, 44.5238861 ],
        [20.61434703, 20.30073408, 19.39063505, ..., 40.45091568,
         39.51188793, 40.08718096],
        ...,
        [15.20498414, 16.70405236, 16.6958771 , ..., 14.96512996,
         16.09915845, 16.28375345],
        [15.95014737, 15.44401933, 16.36107178, ..., 13.13411618,
         13.86219912, 14.25409531],
        [14.45032494, 14.94088309, 11.27504841, ...,  9.55777922,
         11.2378108 , 13.30571821]]])
dataproj = ccrs. PlateCarree ()
# # Plot projection
# # The look you want for the view.
plotproj = ccrs. PlateCarree ()
fig=plt.figure(1, figsize=(15.,12.))
ax=plt.subplot(111,projection=plotproj)
ax.add_feature(cfeature.COASTLINE, linewidth=0.5)
ax.add_feature(cfeature.STATES, linewidth=0.5)
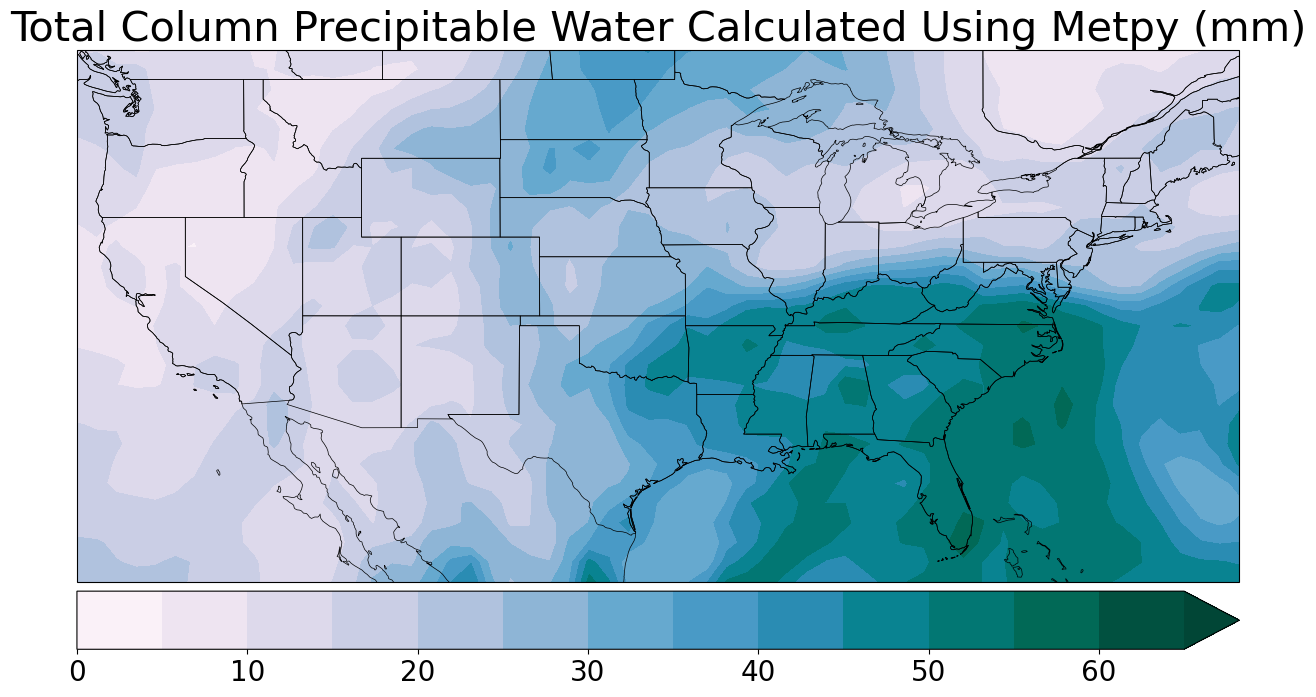
plt.title("Total Column Precipitable Water Calculated Using Metpy (mm)",size = 30)
plt.contourf (new_data.lon, new_data.lat, TCPW[0,:,:],levels =np.arange(0,70,5),cmap = "PuBuGn", transform=dataproj,extend = "max")
plt.colorbar (orientation = "horizontal", pad=0.01).ax.tick_params(labelsize=20)
plt. show ()