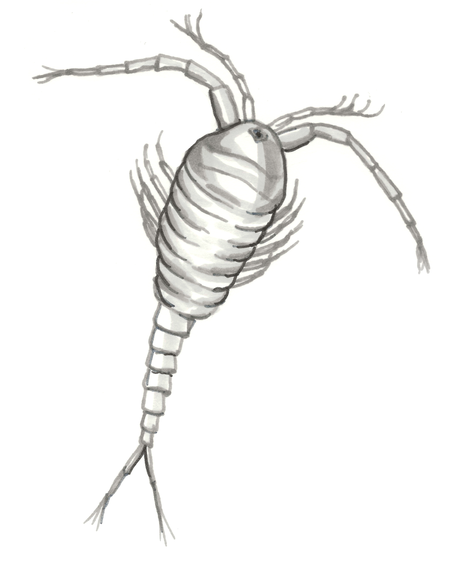
A copepod, a type of zooplankton. Art credit: Kristen Krumhardt
Overview
Zooplankton are tiny oceanic animals, making up the next step up after phytoplankton in the food web. Here we evaluate modeled zooplankton biomass and compare it to observational data.
General setup
Subsetting
Processing - long-term mean
Mapping zooplankton biomass at the surface
Comparing mesozooplankton biomass to observations
Making monthly climatology maps to compare to observations
Prerequisites
| Concepts | Importance | Notes |
|---|---|---|
| Matplotlib | Necessary | |
| Intro to Cartopy | Necessary | |
| Dask Cookbook | Helpful | |
| Intro to Xarray | Helpful |
Time to learn: 30 min
Imports
import xarray as xr
import glob
import numpy as np
import matplotlib.pyplot as plt
import cartopy
import cartopy.crs as ccrs
import pop_tools
from dask.distributed import LocalCluster
import s3fs

from module import adjust_pop_grid
---------------------------------------------------------------------------
ModuleNotFoundError Traceback (most recent call last)
Cell In[1], line 7
3 import numpy as np
4 import matplotlib.pyplot as plt
5 import cartopy
6 import cartopy.crs as ccrs
----> 7 import pop_tools
8 from dask.distributed import LocalCluster
9 import s3fs
10
File ~/micromamba/envs/ocean-bgc-cookbook-dev/lib/python3.14/site-packages/pop_tools/__init__.py:4
1 """Top-level module for pop_tools"""
----> 4 from pkg_resources import DistributionNotFound, get_distribution
6 from .calc import cfc11sol, cfc12sol
7 from .datasets import DATASETS
ModuleNotFoundError: No module named 'pkg_resources'General setup (see intro notebooks for explanations)
Connect to cluster
cluster = LocalCluster()
client = cluster.get_client()
Bring in POP grid utilities
ds_grid = pop_tools.get_grid('POP_gx1v7')
lons = ds_grid.TLONG
lats = ds_grid.TLAT
depths = ds_grid.z_t * 0.01
Load the data
jetstream_url = 'https://js2.jetstream-cloud.org:8001/'

s3 = s3fs.S3FileSystem(anon=True, client_kwargs=dict(endpoint_url=jetstream_url))

# Generate a list of all files in CESM folder
s3path = 's3://pythia/ocean-bgc/cesm/g.e22.GOMIPECOIAF_JRA-1p4-2018.TL319_g17.4p2z.002branch/ocn/proc/tseries/month_1/*'
remote_files = s3.glob(s3path)
s3.invalidate_cache()

# Open all files from folder
fileset = [s3.open(file) for file in remote_files]

# Open with xarray
ds = xr.open_mfdataset(fileset, data_vars="minimal", coords='minimal', compat="override", parallel=True,
                       drop_variables=["transport_components", "transport_regions", 'moc_components'], decode_times=True)

dsSubsetting
variables =['mesozooC', 'microzooC']keep_vars=['z_t','z_t_150m','dz','time_bound','time','TAREA','TLAT','TLONG'] + variables
ds = ds.drop_vars([v for v in ds.variables if v not in keep_vars])Processing - long-term mean
Pull in the function we defined in the nutrients notebook...
def year_mean(ds):
    """
    Source: https://ncar.github.io/esds/posts/2021/yearly-averages-xarray/
    """

    # Make a DataArray with the number of days in each month, size = len(time)
    month_length = ds.time.dt.days_in_month

    # Calculate the weights by grouping by 'time.year'
    weights = (
        month_length.groupby("time.year") / month_length.groupby("time.year").sum()
    )

    # Test that the sum of the weights for each year is 1.0
    np.testing.assert_allclose(weights.groupby("time.year").sum().values, np.ones((len(ds.groupby("time.year")), )))

    # Calculate the weighted average
    return (ds * weights).groupby("time.year").sum(dim="time")
# Take the long-term mean of our data set, processing years and months separately
ds_annual = year_mean(ds).mean("year")Plot mesozooplankton and microzooplankton biomass at the surface
fig = plt.figure(figsize=(8,5))

ax = fig.add_subplot(2,1,1, projection=ccrs.Robinson(central_longitude=305.0))
ax.set_title('microzooC at surface', fontsize=12)
lon, lat, field = adjust_pop_grid(lons, lats,  ds_annual.microzooC.isel(z_t_150m=0))
pc=ax.pcolormesh(lon, lat, field, cmap='Blues',vmin=0,vmax=2,transform=ccrs.PlateCarree())
cbar1 = fig.colorbar(pc, ax=ax,extend='max',label='microzooC (mmol m$^{-3}$)')
land = cartopy.feature.NaturalEarthFeature('physical', 'land', scale='110m', edgecolor='k', facecolor='white', linewidth=0.5)
ax.add_feature(land)


ax = fig.add_subplot(2,1,2, projection=ccrs.Robinson(central_longitude=305.0))
ax.set_title('mesozooC at surface', fontsize=12)
lon, lat, field = adjust_pop_grid(lons, lats,  ds_annual.mesozooC.isel(z_t_150m=0))
pc=ax.pcolormesh(lon, lat, field, cmap='Oranges',vmin=0,vmax=4,transform=ccrs.PlateCarree())
cbar1 = fig.colorbar(pc, ax=ax,extend='max',label='mesozooC (mmol m$^{-3}$)')
land = cartopy.feature.NaturalEarthFeature('physical', 'land', scale='110m', edgecolor='k', facecolor='white', linewidth=0.5)
ax.add_feature(land)
Compare mesozooplankton biomass to COPEPOD database
We use data compiled through the COPEPOD project (Moriarty & O’Brien, 2013). This data has been pre-processed, but the raw data is available on the COPEPOD website.
Read in COPEPOD data
copepod_obs_path = 's3://pythia/ocean-bgc/obs/copepod-2012__cmass-m00-qtr.zarr'

copepod_obs = s3fs.S3Map(root=copepod_obs_path, s3=s3)

ds_copepod = xr.open_dataset(copepod_obs, engine="zarr")

### converting grams to moles
ds_copepod['copepod_C']=ds_copepod.copepod_C/12.011ds_copepodPlot
fig = plt.figure(figsize=(12,3))

ax = fig.add_subplot(1,2,1, projection=ccrs.Robinson(central_longitude=305.0))
ax.set_title('COPEPOD dataset', fontsize=12)
pc=ax.pcolormesh(ds_copepod.lon, ds_copepod.lat, ds_copepod.copepod_C, cmap='Reds',vmin=0,vmax=2,transform=ccrs.PlateCarree())
land = cartopy.feature.NaturalEarthFeature('physical', 'land', scale='110m', edgecolor='k', facecolor='white', linewidth=0.5)
ax.add_feature(land)

ax = fig.add_subplot(1,2,2, projection=ccrs.Robinson(central_longitude=305.0))
ax.set_title('CESM ${\it Mesozooplankton}$ biomass', fontsize=12)
lon, lat, field = adjust_pop_grid(lons, lats, ds_annual.mesozooC.mean(dim='z_t_150m'))
pc=ax.pcolormesh(lon, lat, field, cmap='Reds',vmin=0,vmax=2,transform=ccrs.PlateCarree())
land = cartopy.feature.NaturalEarthFeature('physical', 'land', scale='110m', edgecolor='k', facecolor='white', linewidth=0.5)
ax.add_feature(land)

fig.subplots_adjust(right=0.8)
cbar_ax = fig.add_axes([0.85, 0.15, 0.02, 0.7])
fig.colorbar(pc, cax=cbar_ax,extend='max', label='top 150m/200m mean (mmol m$^{-3}$)');
Making monthly climatology maps to compare to observations
Compare to observation-based GLMM (Generalized Linear Mixed Model) of global mesozooplankton biomass climatology
This data is from Heneghan et al., 2020, which includes the COPEPOD dataset we used previously as well as additional observations, with some pre-processing.
mesozoo_obs_path = 'data/obsglmm_zmeso_vint_200m_monthly_climatology.nc'

ds_copepod_clim = xr.open_dataset(mesozoo_obs_path)
ds_copepod_clim.zmeso200.attrs['units'] = 'mgC m-2'

months = ['Jan','Feb','Mar','Apr','May','Jun','Jul','Aug','Sep','Oct','Nov','Dec']
Make our CESM data into a monthly climatology
mon_ds = ds.copy()
mon_ds = ds.groupby('time.month').mean('time')
### depth integrate and convert model to mg C/m2
mon_ds['mesozooC_zint'] = ((mon_ds.mesozooC) * 10.).sum(dim='z_t_150m') #in mmol/m2
mon_ds['mesozooC_zint'] = mon_ds['mesozooC_zint'] * 12.011 #convert to mgC/m2
mon_ds['mesozooC_zint'].attrs['units'] = 'mgC m-2'Plot
fig = plt.figure(figsize=(5,18))

for row in np.arange(1,13):

    ts=row-1

    plot = row*2 - 1
    ax = fig.add_subplot(12,2,plot, projection=ccrs.Robinson(central_longitude=305.0))
    ax.set_title(months[ts]+' obs', fontsize=12)
    pc=ax.pcolormesh(ds_copepod_clim.Lon, ds_copepod_clim.Lat, ds_copepod_clim.zmeso200.isel(month=ts),
                     cmap='Reds',vmin=0,vmax=4000,transform=ccrs.PlateCarree())
    land = cartopy.feature.NaturalEarthFeature('physical', 'land', scale='110m', edgecolor='k', facecolor='white', linewidth=0.5)
    ax.add_feature(land)

    plot = row*2
    ax = fig.add_subplot(12,2,plot, projection=ccrs.Robinson(central_longitude=305.0))
    ax.set_title(months[ts]+' CESM', fontsize=12)
    tmp = mon_ds.mesozooC_zint.isel(month=ts)
    lon, lat, field = adjust_pop_grid(lons, lats,  tmp)
    pc=ax.pcolormesh(lon, lat, field, cmap='Reds',vmin=0,vmax=4000,transform=ccrs.PlateCarree())
    land = cartopy.feature.NaturalEarthFeature('physical', 'land', scale='110m', edgecolor='k', facecolor='white', linewidth=0.5)
    ax.add_feature(land)

cbar_ax = fig.add_axes([0.92, 0.15, 0.03, 0.7])
fig.colorbar(pc, cax=cbar_ax,extend='max', label='Depth-integrated copepod biomass (mg m$^{-2}$)');
And close the Dask cluster we spun up at the beginning.
cluster.close()Summary
You’ve learned how to evaluate zooplankton biomass modeled by CESM-MARBL and compare it to observations.
Resources and references
- Moriarty, R., & O’Brien, T. D. (2013). Distribution of mesozooplankton biomass in the global ocean. Earth System Science Data, 5(1), 45–55. 10.5194/essd-5-45-2013
- Heneghan, R. F., Everett, J. D., Sykes, P., Batten, S. D., Edwards, M., Takahashi, K., Suthers, I. M., Blanchard, J. L., & Richardson, A. J. (2020). A functional size-spectrum model of the global marine ecosystem that resolves zooplankton composition. Ecological Modelling, 435, 109265. 10.1016/j.ecolmodel.2020.109265
- Moriarty, R., & O’Brien, T. D. (2013). Distribution of mesozooplankton biomass in the global ocean. Earth System Science Data, 5(1), 45–55. 10.5194/essd-5-45-2013
- Petrik, C. M., Luo, J. Y., Heneghan, R. F., Everett, J. D., Harrison, C. S., & Richardson, A. J. (2022). Assessment and Constraint of Mesozooplankton in CMIP6 Earth System Models. Global Biogeochemical Cycles, 36(11). 10.1029/2022gb007367