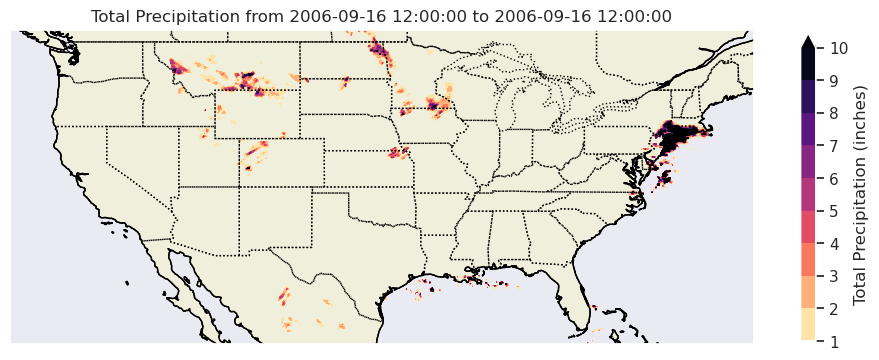
Load in hourly Precip Data and calculate total for storm duration.
zarr_url=f's3://mdmf/gdp/stageiv_combined.zarr/'fs2=fsspec.filesystem('s3',anon=True,endpoint_url='https://usgs.osn.mghpcc.org/')ds=xr.open_dataset(fs2.get_mapper(zarr_url),engine='zarr',backend_kwargs={'consolidated':True},chunks={})ds=ds.sortby('time')# Extract the relevant time rangestart_time='2006-09-16 12:00:00'end_time='2006-09-16 12:00:00'precipitation_data=ds['Total_precipitation_surface_1_Hour_Accumulation'].sel(time=slice(start_time,end_time))# Sum the precipitation values over the specified time rangetotal_precipitation=precipitation_data.sum(dim='time')# Convert total_precipitation to inches#conversion_factor = 0.0393701#total_precipitation = total_precipitation * conversion_factornp.max(total_precipitation)
Total precipitation (1_Hour Accumulation) @ Ground or water surface
standard_name :
precipitation_amount
units :
kg m^-2
Array
Chunk
Bytes
706.20 GiB
49.71 MiB
Shape
(191948, 881, 1121)
(1597, 80, 102)
Dask graph
29964 chunks in 3 graph layers
Data type
float32 numpy.ndarray
crs
()
int32
...
crs_wkt :
GEOGCRS["WGS 84",ENSEMBLE["World Geodetic System 1984 ensemble",MEMBER["World Geodetic System 1984 (Transit)"],MEMBER["World Geodetic System 1984 (G730)"],MEMBER["World Geodetic System 1984 (G873)"],MEMBER["World Geodetic System 1984 (G1150)"],MEMBER["World Geodetic System 1984 (G1674)"],MEMBER["World Geodetic System 1984 (G1762)"],MEMBER["World Geodetic System 1984 (G2139)"],ELLIPSOID["WGS 84",6378137,298.257223563,LENGTHUNIT["metre",1]],ENSEMBLEACCURACY[2.0]],PRIMEM["Greenwich",0,ANGLEUNIT["degree",0.0174532925199433]],CS[ellipsoidal,2],AXIS["geodetic latitude (Lat)",north,ORDER[1],ANGLEUNIT["degree",0.0174532925199433]],AXIS["geodetic longitude (Lon)",east,ORDER[2],ANGLEUNIT["degree",0.0174532925199433]],USAGE[SCOPE["Horizontal component of 3D system."],AREA["World."],BBOX[-90,-180,90,180]],ID["EPSG",4326]]
Aggregated .grib archive from the NCEP. The original Hydrologic Rainfall Analysis Projection grid cell locations redefined by unprojecting grid cell locations using spherical earth projection algorithms. The cell lat/lon locations should be interpreted as being on a modern geotetic datum. This transformation is needed because the original grid cell location's lat/lon values were on a geodetic datum but were assumed to be on a spherical datum. See: https://pubs.usgs.gov/fs/2013/3035/pdf/fs2013-3035.pdf for more information. Note that this publication reverences the National Precipitation Verification Unit. The data represented here are aggregated from the same source as the National Precipitation Verification Unit used prior to being shut down. Data processing notes can be found here: http://www.emc.ncep.noaa.gov/mmb/ylin/pcpanl/
project :
Various
summary :
Mosaicked into a national product at NCEP, from the regional hourly multi-sensor (radar+gauges) precipitation analyses produced by the 12 River Forecast Centers over CONUS. Some manual QC done at the RFCs. The Stage II/IV job is run at 33min past the top of each hour. Hourly Stage IV is re-made hourly (if there is new input after valid time for the next 23 hours, then again at 1/3/5/7 days after valid time. Source: http://www.emc.ncep.noaa.gov/mmb/ylin/pcpanl/stage4/ Note: This dataset is not truely national. Some RFCs do not produce hourly precip estimates and others may not be present in the dataset. Please review the NCEP documentation for more information.
time_coverage_end :
present
time_coverage_start :
2002-01-01T00:00:00Z
title :
United States Stage IV Quantitative Precipitation Archive
lon=ds['lon'].valueslat=ds['lat'].values# Transpose the total_precipitation array if neededtotal_precipitation=total_precipitation.transpose()# Create a larger figure with Cartopyfig,ax=plt.subplots(figsize=(12,8),subplot_kw={'projection':ccrs.PlateCarree()})ax.set_extent([-128,-66.5,24,50],crs=ccrs.PlateCarree())# Add map featuresax.add_feature(cfeature.COASTLINE)ax.add_feature(cfeature.BORDERS,linestyle=':')ax.add_feature(cfeature.STATES,linestyle=':')ax.add_feature(cfeature.LAND,edgecolor='black')# Plot the total precipitation on the mapc=ax.contourf(lon,lat,total_precipitation,cmap='magma_r',levels=range(1,11),extend='max',transform=ccrs.PlateCarree())colorbar=plt.colorbar(c,ax=ax,label='Total Precipitation (inches)',shrink=0.5)# Adjust the shrink parameter as needed# Add title and labelsplt.title('Total Precipitation from {} to {}'.format(start_time,end_time))plt.xlabel('Longitude')plt.ylabel('Latitude')# Show the plotplt.show()
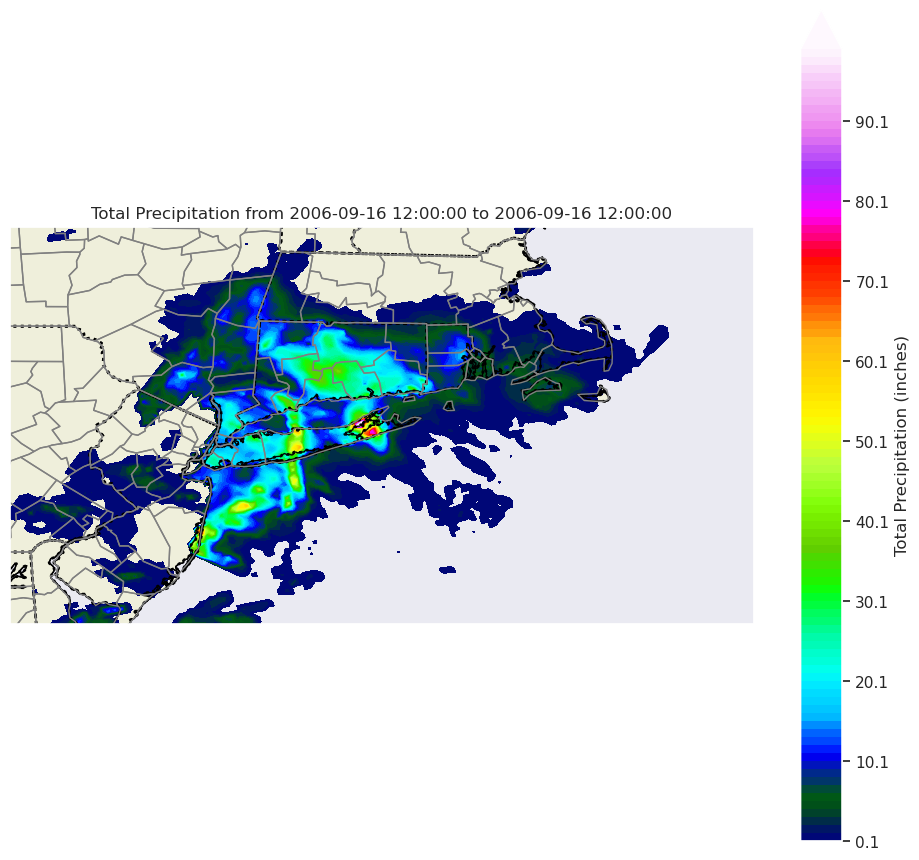
fig,ax=plt.subplots(figsize=(12,12),subplot_kw={'projection':ccrs.PlateCarree()})ax.set_extent([-82,-66.5,35,48],crs=ccrs.PlateCarree())ax.set_extent([-76,-68.5,39,43],crs=ccrs.PlateCarree())# Add map featuresax.add_feature(cfeature.COASTLINE)ax.add_feature(cfeature.BORDERS,linestyle=':')ax.add_feature(cfeature.STATES,linestyle=':',linewidth=2)ax.add_feature(cfeature.LAND,edgecolor='black')ax.add_feature(USCOUNTIES,edgecolor='grey',linewidth=1)# Plot the total precipitation on the map (levels=range(1,10) OR WHAT I HAVE NOWc=ax.contourf(lon,lat,total_precipitation,cmap='gist_ncar',levels=np.arange(0.1,100,1),extend='max',transform=ccrs.PlateCarree())colorbar=plt.colorbar(c,ax=ax,label='Total Precipitation (inches)',shrink=0.9)# Adjust the shrink parameter as needed# Add title and labelsplt.title('Total Precipitation from {} to {}'.format(start_time,end_time))plt.xlabel('Longitude')plt.ylabel('Latitude')# Show the plotplt.show()
Downloading file 'us_counties_20m.cpg' from 'https://github.com/Unidata/MetPy/raw/v1.6.2/staticdata/us_counties_20m.cpg' to '/home/runner/.cache/metpy/v1.6.2'.
Downloading file 'us_counties_20m.dbf' from 'https://github.com/Unidata/MetPy/raw/v1.6.2/staticdata/us_counties_20m.dbf' to '/home/runner/.cache/metpy/v1.6.2'.
Downloading file 'us_counties_20m.prj' from 'https://github.com/Unidata/MetPy/raw/v1.6.2/staticdata/us_counties_20m.prj' to '/home/runner/.cache/metpy/v1.6.2'.
Downloading file 'us_counties_20m.shx' from 'https://github.com/Unidata/MetPy/raw/v1.6.2/staticdata/us_counties_20m.shx' to '/home/runner/.cache/metpy/v1.6.2'.
Downloading file 'us_counties_20m.shp' from 'https://github.com/Unidata/MetPy/raw/v1.6.2/staticdata/us_counties_20m.shp' to '/home/runner/.cache/metpy/v1.6.2'.