ARCO ERA-5 Interactive Visualization Cookbook
![]()
![]()
![]()
A team at Google Research & Cloud are making parts of the ECMWF Reanalysis version 5 (aka ERA-5) accessible in a Analysis Ready, Cloud Optimized (aka ARCO) format.
This Project Pythia Cookbook covers accessing, regridding, and visualizing this reanalysis data.
Motivation
The ERA-5 represents the current state-of-the-art meteorological reanalysis, extending from well back into the 20th century to the present. While the data is freely-available for download by archival centers such as Copernicus and RDA, the data format and directory structure are typically not well-suited for interactive exploration. Specifically, parameters of interest are stored in individual files, for a limited period of time.
A team at Google Cloud and Research has made interactive exploration much more tenable by representing the data in Zarr format. Each Zarr file represents a specific “class” of meteorological data, such as:
Model Level Wind
Model Level Moisture
Single Level Surface
Single Level Reanalysis
Single Level Forecast
Within each Zarr file, a variety of meteorological parameters, spanning the current period of record (1 January 1979 –> 31 August 2021) of the ARCO ERA-5 repository exist.
In the notebooks which comprise this Cookbook, we demonstrate the following:
Access parameters of interest from the Zarr store
Regrid from model native (Guassian) to lat-lon (Cartesian) coordinates
Plot a map at a specific time using Matplotlib and Cartopy
Create interactive visualizations, leveraging the Holoviz ecosystem
Authors
Kevin Tyle, Michael Barletta, Negin Sobhani, Nicholas Cote , Harsha Hampapura , and Philip Chmielowiec
We also gratefully acknowledge the Google Cloud Research team for making an ARCO-friendly version of the ERA-5 available. Citations for their effort and the ERA-5 reanalysis are below:
Carver, Robert W, and Merose, Alex. (2023): ARCO-ERA5: An Analysis-Ready Cloud-Optimized Reanalysis Dataset. 22nd Conf. on AI for Env. Science, Denver, CO, Amer. Meteo. Soc, 4A.1, https://ams.confex.com/ams/103ANNUAL/meetingapp.cgi/Paper/415842
Hersbach, H., Bell, B., Berrisford, P., Hirahara, S., Horányi, A., Muñoz‐Sabater, J., Nicolas, J., Peubey, C., Radu, R., Schepers, D., Simmons, A., Soci, C., Abdalla, S., Abellan, X., Balsamo, G., Bechtold, P., Biavati, G., Bidlot, J., Bonavita, M., De Chiara, G., Dahlgren, P., Dee, D., Diamantakis, M., Dragani, R., Flemming, J., Forbes, R., Fuentes, M., Geer, A., Haimberger, L., Healy, S., Hogan, R.J., Hólm, E., Janisková, M., Keeley, S., Laloyaux, P., Lopez, P., Lupu, C., Radnoti, G., de Rosnay, P., Rozum, I., Vamborg, F., Villaume, S., Thépaut, J-N. (2017): Complete ERA5: Fifth generation of ECMWF atmospheric reanalyses of the global climate. Copernicus Climate Change Service (C3S) Data Store (CDS). Hersbach et al, (2017) was downloaded from the Copernicus Climate Change Service (C3S) Climate Data Store. We thank C3S for allowing us to redistribute the data. The results contain modified Copernicus Climate Change Service information 2022. Neither the European Commission nor ECMWF is responsible for any use that may be made of the Copernicus information or data it contains.
Contributors
Structure
This cookbook currently consists of multiple notebooks that access, regrid, and visualize the ARCO ERA-5 repository. Additionally we cover a section on how to preprocess and create ARCO files.
Additional notebooks will follow.
Section 1 ( “Basic Visualization” )
This notebook reads in a sea-level pressure ERA-5 grid, regrids from Gaussian to Cartesian coordinates, and visualizes the data with Matplotlib and Cartopy.
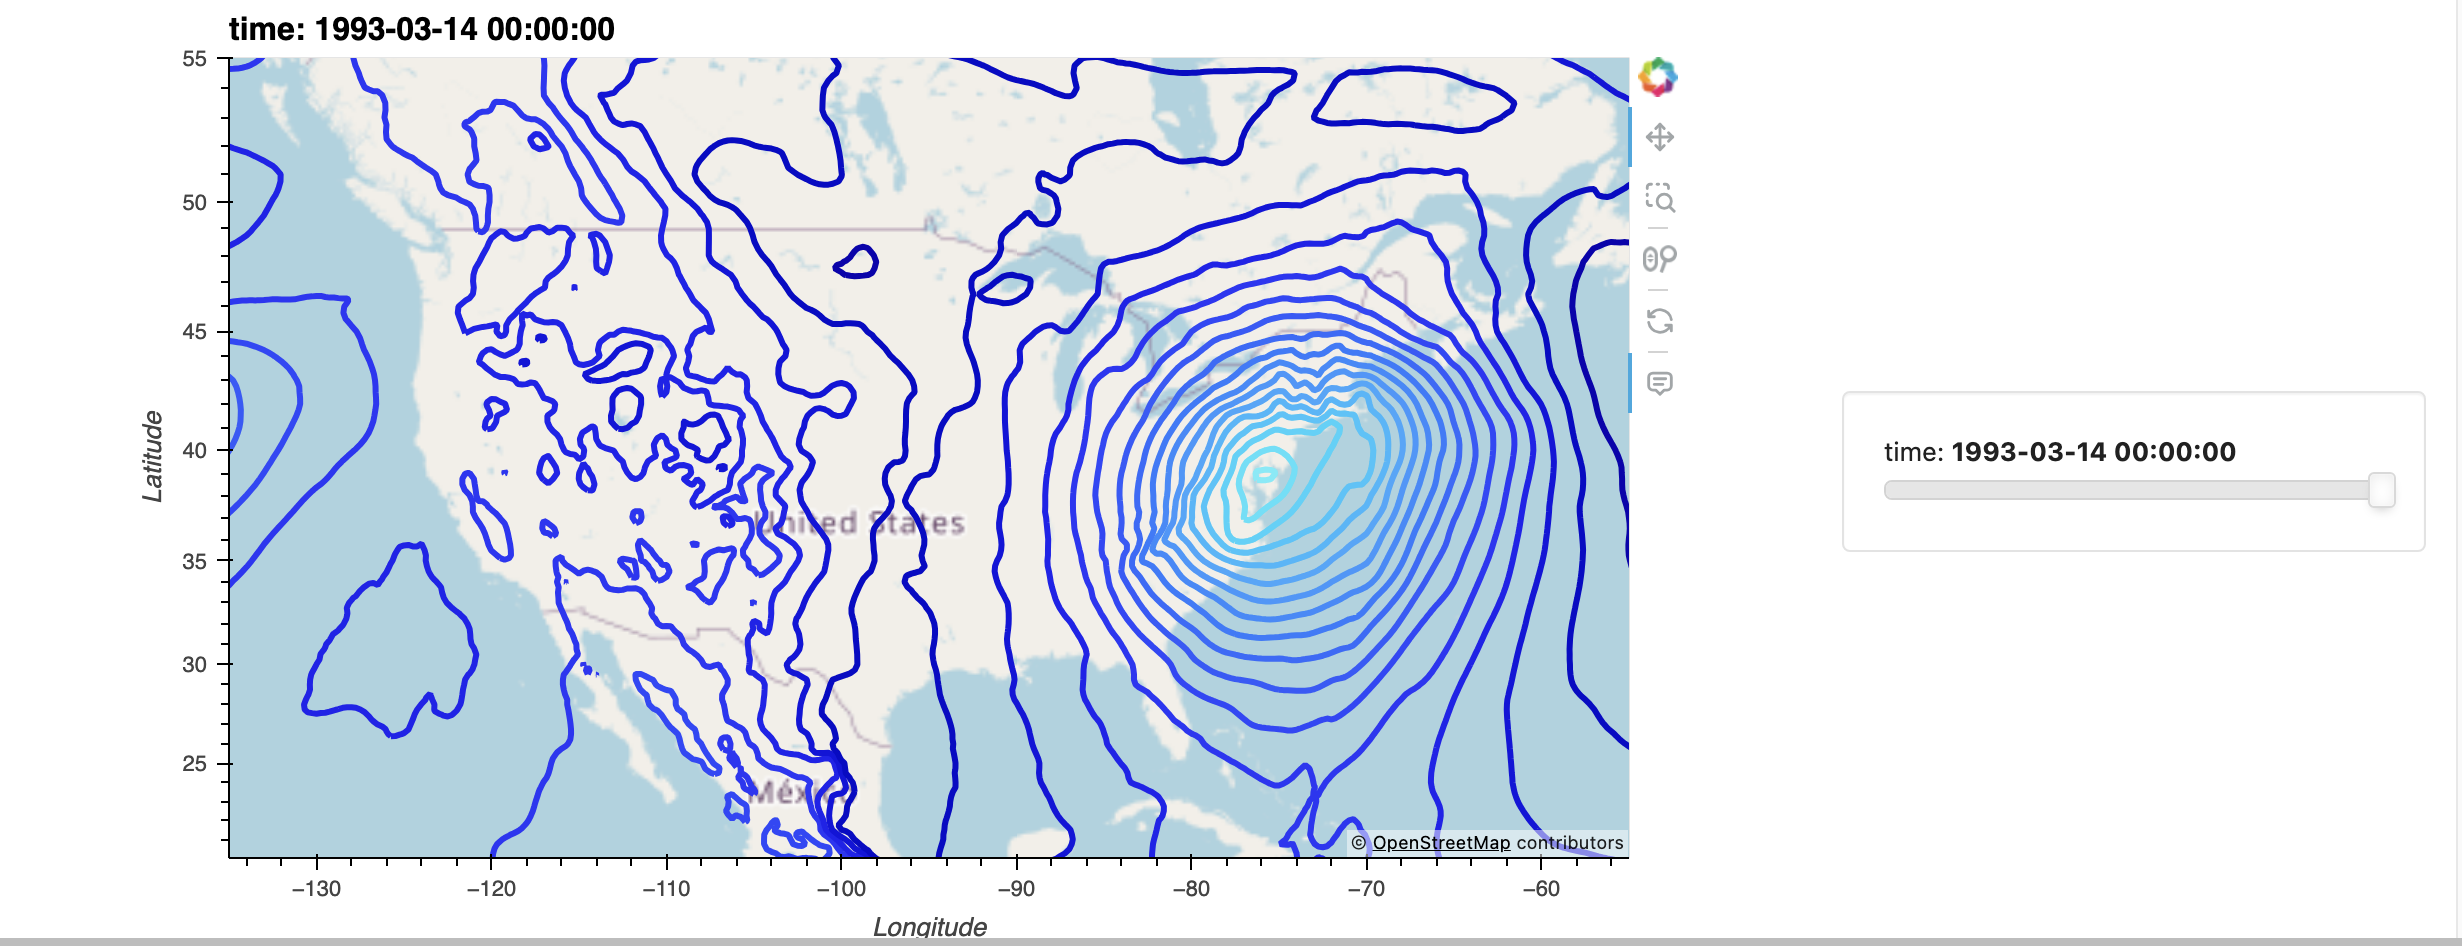
Section 2 ( “Interactive Visualization Part 1: GeoViews” )
This notebook reads in sea-level pressure and 2-meter temperature ERA-5 grids, regrids as in the first notebook, and visualizes the data in an interactive manner using Geoviews.
Section 3 (“Interactive Visualization Part 2: hvPlot”)
This notebook reads in annual average 2-m temperature from RDA’s Zarr store and visualizes the data using hvPlot. The notebook also demonstrates how to create a simple interactive plot that allows the user to select a specific year and visualize the 2-m and how to create animations.
Section 4 (“Creating an Interactive Dashboard with Panel”)
This notebook demonstrates how to create an interactive dashboard using Panel that allows the user to select a specific year and visualize the 2-m temperature.
Preprocessing Notebooks for NCAR RDA
Section 5 ( “Generate annual/yearly Zarr stores from hourly ERA5 NetCDF files on NCAR’s Research Data Archive”)
This notebook demonstrates how to preprocess hourly ERA5 NetCDF files from NCAR’s Research Data Archive (RDA) and generate annual/yearly Zarr stores.
Section 6 ( “Calculate Temperature Anomalies”)
This notebook demonstrates how to calculate temperature anomalies from the annual 2-m temperature Zarr store generated in Section 5.
Running the Notebooks
You can either run the notebook using Binder or on your local machine.
Running on Binder
The simplest way to interact with a Jupyter Notebook is through Binder, which enables the execution of a Jupyter Book in the cloud. The details of how this works are not important for now. All you need to know is how to launch a Pythia Cookbooks chapter via Binder. Simply navigate your mouse to the top right corner of the book chapter you are viewing and click on the rocket ship icon, (see figure below), and be sure to select “launch Binder”. After a moment you should be presented with a notebook that you can interact with. I.e. you’ll be able to execute and even change the example programs. You’ll see that the code cells have no output at first, until you execute them by pressing Shift+Enter. Complete details on how to interact with a live Jupyter notebook are described in Getting Started with Jupyter.
Running on Your Own Machine
If you are interested in running this material locally on your computer, you will need to follow this workflow:
Clone the
https://github.com/ProjectPythia/ERA5_interactive-cookbookrepository:git clone https://github.com/ProjectPythia/ERA5_interactive-cookbook.git
Move into the
ERA5_interactive-cookbookdirectorycd ERA5_interactive-cookbook
Create and activate your conda/mamba environment from the
environment.ymlfilemamba env create -f environment.yml mamba activate ERA5_interactive
Move into the
notebooksdirectory and start up Jupyterlabcd notebooks/ jupyter lab