A Bayesian implementation of a Schaefer Surplus Production population dynamics model
Background
A Surplus Production Model (SPM) describes the population biomass dynamics as a single biomass entity, conditioned on relative abundance observations. SPMs are based on theta-logistic density-dependent population growth theory, where population growth rates are higher at low abundance, and lower when approaching the carrying capacity.
For a SPM in discrete time, the biomass (B) at a given point in time (usually years) can be described as a function of the biomass, surplus production (P), and catch (C) at the previous year.
The surplus production (i.e. the population growth in biomass at a given point in time) is a function of two parameters: the intrinsic rate of increase (), and carrying capacity (K):
Observations are indices of relative abundance () scaled to biomass through (estimated) cachability coefficients :
Model Setup
Data: Observed catches
Cand one or more survey indices (columns starting with “Survey” followed by a number) over multiple years.
Likelihood
For each survey index, the likelihood is based on the log-normal errors between observed survey values and predicted biomass. The model assumes:
The observed survey index at time is .
The predicted biomass at time (from the Schaefer model) is .
The catchability coefficient scales the expected survey to the biomass:
The scaled prediction for the survey is .
The residuals follow a log-normal distribution:
This means that for each year , the probability density of observing given predicted and is:
For each residual:
and
The total likelihood across years is the product of these normal pdfs across observations.
Prior
Priors are placed on the parameters:
These are combined into the total NLL for use in Metropolis-Hastings.
Posterior
The (unormalized) posterior combines the likelihood and priors:
Metropolis-Hastings Algorithm Steps in the Code
Initialization:
Chains are initialized at given starting values (
inits).
Proposal Step:
At each iteration, propose new values for , , and using normal random walks:
Hard rejection if the proposed .
Acceptance Ratio:
Compute the difference in negative log-likelihoods (including priors) between proposal and current values.
Accept the proposal with probability .
Update Step:
If accepted, set ; otherwise, retain previous values.
Repeat for
nIteriterations, discardingnBurnInas burn-in.
import numpy as np
import pandas as pd
import matplotlib.pyplot as plt
from scipy.stats import gaussian_kde
def detect_survey_cols(data):
# Find all columns that start with 'Survey'
return [col for col in data.columns if col.lower().startswith("survey")]
def NLL(par, data, survey_cols, priorMean, priorVar, printStep=False):
r, k, sigma = float(par[0]), float(par[1]), float(par[2])
nYears = len(data)
B = np.zeros(nYears)
B[0] = k
for t in range(1, nYears):
B[t] = max(1, B[t-1] + r * B[t-1] * (1 - B[t-1] / k) - data['C'].iloc[t-1])
# Likelihood components for each survey
NLLs = []
for survey_col in survey_cols:
survey_vals = data[survey_col]
Q = np.exp(np.nanmean(np.log(survey_vals / B)))
PB = survey_vals / Q
SSQ = np.log(B / PB) ** 2
idx = ~np.isnan(SSQ)
L = 1 / np.sqrt(2 * np.pi * sigma ** 2) * np.exp(-SSQ[idx] / (2 * sigma ** 2))
NLLs.append(-np.log(L))
# Priors
rPriorL = -((r - priorMean[0]) ** 2 / (2 * priorVar[0]))
kPriorL = -((k - priorMean[1]) ** 2 / (2 * priorVar[1]))
sigmaPriorL = -((sigma - priorMean[2]) ** 2 / (2 * priorVar[2]))
priorL = rPriorL + kPriorL + sigmaPriorL
# Total negative log-likelihood (minus sum for M-H log acceptance ratio)
totalNLL = sum(-np.sum(nll) for nll in NLLs) + priorL
if printStep:
print(f"r: {r:.4f} k: {k:.2f} sigma: {sigma:.4f} nll: {totalNLL:.2f}")
return totalNLL
def schaeferMCMC(data, inits, nIter, nBurnIn, delta, priors, nChains=2):
"""
Metropolis-Hastings sampler for the Schaefer biomass model.
Now uses a vector of proposal standard deviations (delta) for each parameter:
delta[0] = for r
delta[1] = for k
delta[2] = for sigma
"""
survey_cols = detect_survey_cols(data)
priorMean = priors[:3]
priorVar = priors[3:]
if not (isinstance(delta, (list, tuple, np.ndarray)) and len(delta) == 3):
raise ValueError("delta must be a list/tuple/array of length 3: [delta_r, delta_k, delta_sigma]")
chains = []
for chain_idx in range(nChains):
r = np.zeros(nIter)
k = np.zeros(nIter)
sigma = np.zeros(nIter)
if isinstance(inits[0], (list, np.ndarray)):
r[0], k[0], sigma[0] = inits[chain_idx]
else:
r[0], k[0], sigma[0] = inits
for i in range(1, nIter):
rHat = np.random.normal(r[i-1], delta[0])
kHat = np.random.normal(k[i-1], delta[1])
sigmaHat = abs(np.random.normal(sigma[i-1], delta[2]))
if rHat <= 0:
r[i], k[i], sigma[i] = r[i-1], k[i-1], sigma[i-1]
continue
logR = NLL([rHat, kHat, sigmaHat], data, survey_cols, priorMean, priorVar) - \
NLL([r[i-1], k[i-1], sigma[i-1]], data, survey_cols, priorMean, priorVar)
accept_prob = min(1, np.exp(logR))
if np.random.uniform() <= accept_prob:
r[i], k[i], sigma[i] = rHat, kHat, sigmaHat
else:
r[i], k[i], sigma[i] = r[i-1], k[i-1], sigma[i-1]
# Burn-in removal
rSamples = r[nBurnIn:]
kSamples = k[nBurnIn:]
sigmaSamples = sigma[nBurnIn:]
chains.append(pd.DataFrame({
'r': rSamples,
'k': kSamples,
'sigma': sigmaSamples
}))
# Plotting
fig, axs = plt.subplots(2, 3, figsize=(15, 8))
colors = ['black', '#FF000088', 'blue', 'green', 'orange', 'purple']
# Traceplots
for j, param in enumerate(['r', 'k', 'sigma']):
for cidx, chain in enumerate(chains):
axs[0, j].plot(chain[param], color=colors[cidx % len(colors)], alpha=0.7, label=f'Chain {cidx+1}' if j==0 else None)
axs[0, j].set_title(f'Trace: {param}')
if j == 0:
axs[0, j].legend()
# Density plots
for j, param in enumerate(['r', 'k', 'sigma']):
for cidx, chain in enumerate(chains):
kde = gaussian_kde(chain[param])
x_vals = np.linspace(chain[param].min(), chain[param].max(), 200)
axs[1, j].plot(x_vals, kde(x_vals), color=colors[cidx % len(colors)], label=f'Chain {cidx+1}')
axs[1, j].set_title(f'Density: {param}')
axs[1, j].legend()
plt.tight_layout()
plt.show()
# Posterior summaries (mean and sd per chain)
summaries = []
for chain in chains:
summaries.append(pd.DataFrame({
'Mean': [chain['r'].mean(), chain['k'].mean(), chain['sigma'].mean()],
'SD': [chain['r'].std(), chain['k'].std(), chain['sigma'].std()]
}, index=['r', 'k', 'sigma']))
output = {
'chains': chains,
'summaries': summaries,
'survey_cols': survey_cols
}
return output
def schaefer_post_plots(data, mcmc_samples, survey_cols):
nYears = len(data)
nSamples = len(mcmc_samples)
biomass_matrix = np.zeros((nSamples, nYears))
# Calculate biomass time series for each posterior sample
for s in range(nSamples):
r = mcmc_samples.iloc[s]['r']
k = mcmc_samples.iloc[s]['k']
B = np.zeros(nYears)
B[0] = k
for t in range(1, nYears):
B[t] = max(1, B[t-1] + r * B[t-1] * (1 - B[t-1] / k) - data['C'].iloc[t-1])
biomass_matrix[s, :] = B
biomass_mean = biomass_matrix.mean(axis=0)
biomass_lower = np.percentile(biomass_matrix, 2.5, axis=0)
biomass_upper = np.percentile(biomass_matrix, 97.5, axis=0)
# ----- SCALE THE SURVEYS -----
scaled_surveys = {}
for survey_col in survey_cols:
survey_vals = data[survey_col].values
mask = survey_vals > 0
# Avoid division by zero or log of zero with masking
q = np.exp(np.nanmean(np.log(survey_vals[mask] / biomass_mean[mask])))
scaled_surveys[survey_col] = survey_vals / q
# ----- Plotting -----
fig, axs = plt.subplots(1, 3, figsize=(15, 5))
# 1. Biomass time series with CI and scaled surveys
axs[0].plot(biomass_mean, color='black', label='Mean')
axs[0].plot(biomass_lower, color='black', linestyle='--', label='Lower CI')
axs[0].plot(biomass_upper, color='black', linestyle='--', label='Upper CI')
colors = ['red', 'blue', 'green', 'orange', 'purple']
for idx, (survey_col, scaled) in enumerate(scaled_surveys.items()):
axs[0].plot(np.arange(nYears), scaled, 'o', label=survey_col, color=colors[idx % len(colors)])
axs[0].set_ylabel("biomass")
axs[0].set_xlabel("Index")
axs[0].legend()
# 2. B/Bmsy
k_samples = mcmc_samples['k'].values
bbmsy_matrix = biomass_matrix / (k_samples[:, None] / 2)
bbmsy_mean = bbmsy_matrix.mean(axis=0)
axs[1].plot(bbmsy_mean, color='black')
axs[1].set_ylabel("biomassSB/(k/2)")
axs[1].set_xlabel("Index")
axs[1].set_title("B/Bmsy")
# 3. F/Fmsy
catch = data['C'].values
r_samples = mcmc_samples['r'].values
f_matrix = catch / biomass_matrix
fmsy_matrix = r_samples[:, None] / 2
ffmsy_matrix = f_matrix / fmsy_matrix
ffmsy_mean = ffmsy_matrix.mean(axis=0)
axs[2].plot(ffmsy_mean, color='black')
axs[2].set_ylabel("FM/Fmsy")
axs[2].set_xlabel("Index")
axs[2].set_title("F/Fmsy")
plt.tight_layout()
plt.show()
return {
"biomass_mean": biomass_mean,
"biomass_lower": biomass_lower,
"biomass_upper": biomass_upper,
"scaled_surveys": scaled_surveys
}You can find some example usage below. Be warned that way more iterations (nIter and nBurnIn) are needed to achieve appropriate chain mixing and accurate parameter estimation. The example in this cookbook runs with fewer iterations due to computational limitations involved in deploying the cookbook.
# --- Example usage ---
data = pd.read_csv('../data/data.csv')
print("Data loaded:", data.shape) # rows, cols

# Initial parameters, number of iterations, burn-in, delta, priors
inits = [0.19, 144000, 0.9] # r, k, sigma
nIter = 10000 # reduce for testing
nBurnIn = 1000
delta = [0.0075, 20000, 0.05] # proposal distribution variances
priors = [0.23, 144000, 0.9, 0.005, 50000, 0.01]  # priors: means (1:3) and variances (4:6)

result = schaeferMCMC(data, inits, nIter, nBurnIn, delta, priors)

# Print means and SDs for each chain
for i, summary in enumerate(result['summaries']):
    print(f"Chain {i+1} parameter means and SDs:\n{summary}\n")

schaefer_post_plots(data, result['chains'][1], result['survey_cols'])
Data loaded: (106, 4)
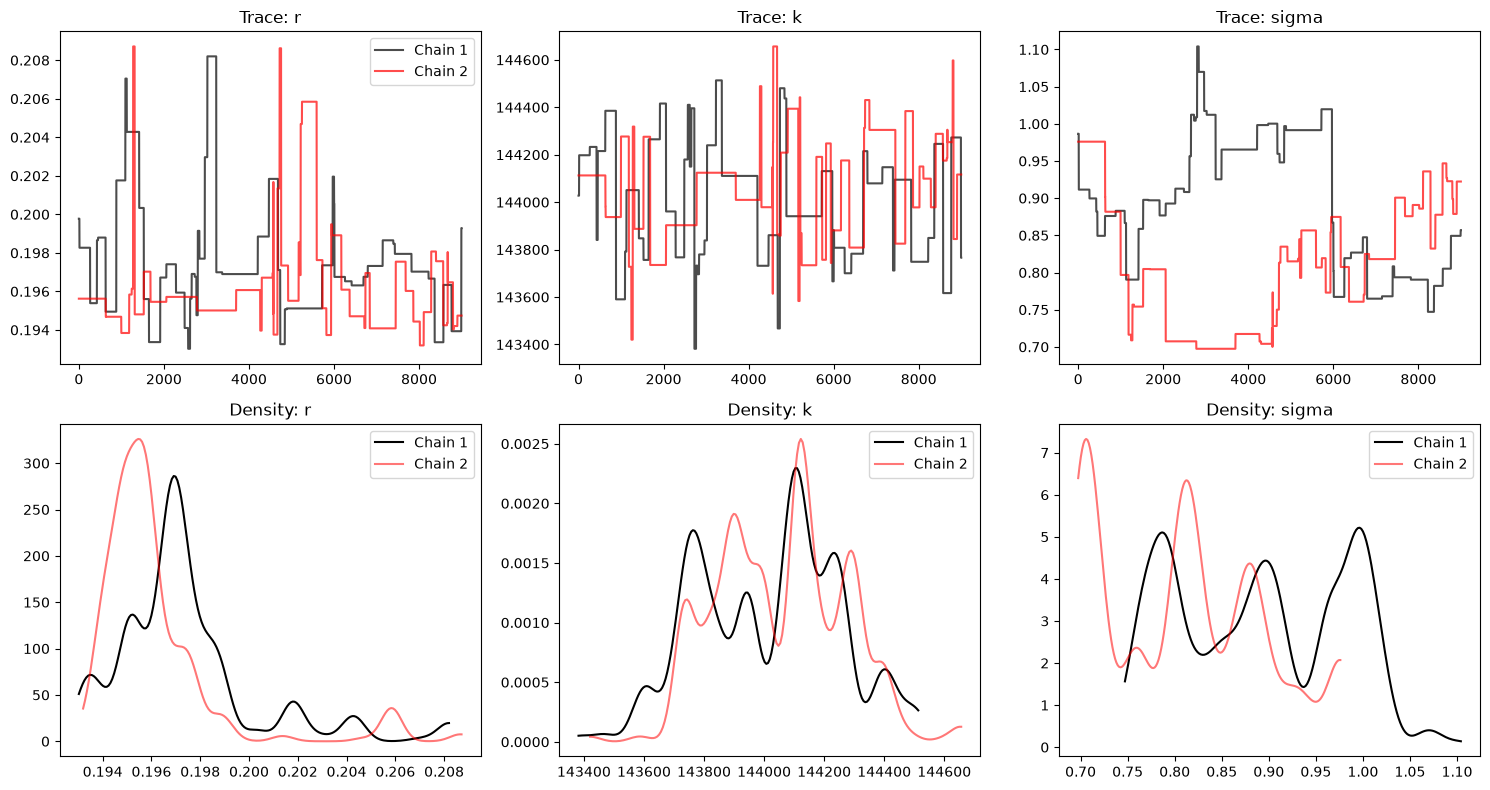
Chain 1 parameter means and SDs:
                Mean          SD
r           0.197385    0.002951
k      144017.244617  235.361362
sigma       0.891963    0.088519

Chain 2 parameter means and SDs:
                Mean          SD
r           0.196143    0.002650
k      144056.637323  210.385167
sigma       0.808503    0.085225
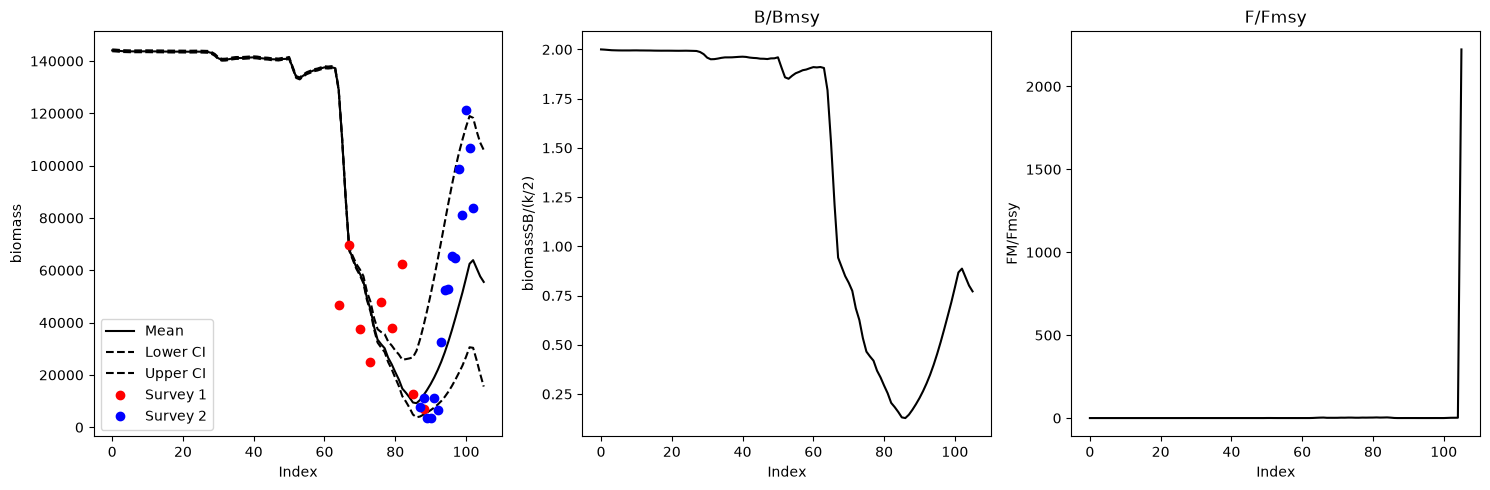
{'biomass_mean': array([144056.63732285, 143978.63732285, 143871.92822773, 143768.11070624,
        143727.58823719, 143692.97824653, 143682.12252692, 143684.38364952,
        143679.20227326, 143703.03088565, 143710.20854022, 143682.98467648,
        143677.07355217, 143662.31532055, 143652.43585114, 143619.48299691,
        143604.95546614, 143593.25927165, 143597.84208635, 143596.5312428 ,
        143588.47548798, 143568.98932042, 143561.29957275, 143574.10744542,
        143591.41982854, 143561.35864079, 143528.15441532, 143484.41646481,
        143105.19146332, 142329.56167036, 141043.23491192, 140461.90277321,
        140506.35019897, 140707.49625249, 140975.06578666, 141142.48709121,
        141148.43111999, 141165.25329715, 141251.90628796, 141343.23295272,
        141400.3316539 , 141310.64813336, 141077.89622792, 140947.98281541,
        140872.47255346, 140672.12381843, 140643.27810231, 140538.81994878,
        140777.86199805, 140805.22617317, 141168.46547699, 137436.49322518,
        133854.21550413, 133325.50901376, 134426.39728174, 135336.83491938,
        135851.41678469, 136449.90949347, 136706.88662357, 137171.68912687,
        137585.3303395 , 137477.36243068, 137623.65910685, 137259.85579597,
        129142.86214572, 109924.04908076,  87173.46992059,  67893.93883369,
         64492.51066006,  61135.01371456,  58706.24282091,  55754.34241157,
         49363.4321558 ,  45082.70358496,  38448.76488138,  33515.12736843,
         31762.10433922,  30205.71294487,  26539.87620543,  24067.69785609,
         21085.07546541,  18291.57991383,  14765.16522528,  13207.35764579,
         11445.54395897,   9463.03312172,   9210.77276375,  10437.80938123,
         12244.89304826,  14286.0678756 ,  16520.92952671,  19051.4171225 ,
         21891.15210705,  25062.43028658,  28688.63222166,  32716.05734639,
         37103.59925582,  41804.40298388,  46664.59922028,  51585.65504621,
         56968.73522657,  62485.81964823,  63875.34311192,  60773.10745313,
         57686.91946691,  55559.35528873]),
 'biomass_lower': array([143734.09231232, 143656.09231232, 143550.1395661 , 143446.53648257,
        143405.85134656, 143371.08430548, 143360.08001917, 143362.21556054,
        143356.93586307, 143380.68273773, 143387.8117288 , 143360.55409703,
        143354.59745884, 143339.79898317, 143329.87739063, 143296.88426202,
        143282.30209567, 143270.55247647, 143275.08476892, 143273.73688235,
        143265.65076352, 143246.1349142 , 143238.40817814, 143251.18134563,
        143268.47491547, 143238.41065518, 143205.18334186, 143161.40421939,
        142782.11641866, 142006.17640568, 140719.07099029, 140136.23691958,
        140179.08024179, 140378.96630023, 140645.66166668, 140812.56662344,
        140818.21302272, 140834.80061924, 140921.27723761, 141012.52317961,
        141069.62124545, 140979.97733714, 140747.19435046, 140617.09292887,
        140541.34074703, 140340.74482236, 140311.56005895, 140206.80913769,
        140445.54246434, 140472.82658176, 140836.02086218, 137104.26859632,
        133519.55994078, 132986.39399629, 134083.24043857, 134991.12692356,
        135504.27024162, 136101.96012332, 136358.71994099, 136823.53441494,
        137237.52785872, 137130.15152552, 137276.84967936, 136913.48031684,
        128796.57277943, 109572.00299395,  86803.40105487,  67492.64635301,
         64027.59034471,  60599.791183  ,  58095.97110021,  55064.01770089,
         48586.24883405,  44205.2697752 ,  37457.67768343,  32389.3312699 ,
         30478.44116219,  28743.13775244,  24874.09673023,  22162.59116537,
         18900.81378583,  15777.28626288,  11859.23672156,   9828.91491102,
          7508.89087289,   4862.59874123,   3815.37618752,   4109.55441537,
          4844.85525605,   5669.4110967 ,   6534.77714401,   7536.33853476,
          8686.83158717,  10013.06498394,  11649.94942308,  13568.5391562 ,
         15761.18621702,  18223.68934715,  20853.3550096 ,  23602.90920617,
         26924.32675444,  30577.23206155,  30370.99746904,  25626.62575655,
         20425.18997299,  15561.30628714]),
 'biomass_upper': array([144430.51637464, 144352.51637464, 144245.87053145, 144142.19087386,
        144101.86452386, 144067.44670263, 144056.77516174, 144059.19470681,
        144054.14016981, 144078.07599312, 144085.32133647, 144058.1465694 ,
        144052.29740485, 144037.59427284, 144027.77152781, 143994.87275903,
        143980.41593931, 143968.78899396, 143973.43757092, 143972.17641399,
        143964.1620733 , 143944.71608746, 143937.07482761, 143949.92834469,
        143967.26737602, 143937.21372323, 143904.04007109, 143860.35398758,
        143481.20674596, 142705.94865997, 141420.55436774, 140841.02540996,
        140887.421876  , 141090.13162042, 141358.81954708, 141526.9375545 ,
        141533.31382828, 141550.48470436, 141637.4089742 , 141728.88558313,
        141786.03089107, 141696.3377782 , 141463.65225953, 141333.98624074,
        141258.78639792, 141058.75471206, 141030.33526683, 140926.25071654,
        141165.68609874, 141193.17376946, 141556.49134582, 137824.27971209,
        134244.89447948, 133721.52306719, 134827.31949352, 135740.95373675,
        136257.43432637, 136857.06817587, 137114.47733509, 137579.41509187,
        137992.76347822, 137884.19152717, 138030.08094911, 137665.81246861,
        129548.74867211, 110336.7738998 ,  87607.5920285 ,  68486.66454683,
         65425.06189206,  62418.39200105,  60356.297999  ,  57789.30702227,
         51808.24607149,  47983.78349172,  41854.64483408,  37499.42535447,
         36407.65253983,  35591.70105026,  32756.92410365,  31246.09982891,
         29367.76184722,  27857.8286277 ,  25827.82779695,  26040.03611879,
         26326.16347331,  26720.73076039,  29236.54276803,  33601.61173589,
         38859.38878482,  44608.83894264,  50746.5153962 ,  57291.43820068,
         64143.94706203,  71192.28818936,  78411.39839534,  85580.82465388,
         92508.24971202,  99024.84020478, 104896.34192868, 110008.74566889,
        114802.06239211, 118950.81609906, 118278.71872778, 113181.61352312,
        108831.88451815, 105995.78705558]),
 'scaled_surveys': {'Survey 1': array([           nan,            nan,            nan,            nan,
                    nan,            nan,            nan,            nan,
                    nan,            nan,            nan,            nan,
                    nan,            nan,            nan,            nan,
                    nan,            nan,            nan,            nan,
                    nan,            nan,            nan,            nan,
                    nan,            nan,            nan,            nan,
                    nan,            nan,            nan,            nan,
                    nan,            nan,            nan,            nan,
                    nan,            nan,            nan,            nan,
                    nan,            nan,            nan,            nan,
                    nan,            nan,            nan,            nan,
                    nan,            nan,            nan,            nan,
                    nan,            nan,            nan,            nan,
                    nan,            nan,            nan,            nan,
                    nan,            nan,            nan,            nan,
         46673.23520396,            nan,            nan, 69720.39641341,
                    nan,            nan, 37610.03393571,            nan,
                    nan, 24989.73522152,            nan,            nan,
         47863.22259546,            nan,            nan, 37854.46377829,
                    nan,            nan, 62509.71605734,            nan,
                    nan, 12742.51363548,            nan,            nan,
          6876.19741359,            nan,            nan,            nan,
                    nan,            nan,            nan,            nan,
                    nan,            nan,            nan,            nan,
                    nan,            nan,            nan,            nan,
                    nan,            nan]),
  'Survey 2': array([            nan,             nan,             nan,             nan,
                     nan,             nan,             nan,             nan,
                     nan,             nan,             nan,             nan,
                     nan,             nan,             nan,             nan,
                     nan,             nan,             nan,             nan,
                     nan,             nan,             nan,             nan,
                     nan,             nan,             nan,             nan,
                     nan,             nan,             nan,             nan,
                     nan,             nan,             nan,             nan,
                     nan,             nan,             nan,             nan,
                     nan,             nan,             nan,             nan,
                     nan,             nan,             nan,             nan,
                     nan,             nan,             nan,             nan,
                     nan,             nan,             nan,             nan,
                     nan,             nan,             nan,             nan,
                     nan,             nan,             nan,             nan,
                     nan,             nan,             nan,             nan,
                     nan,             nan,             nan,             nan,
                     nan,             nan,             nan,             nan,
                     nan,             nan,             nan,             nan,
                     nan,             nan,             nan,             nan,
                     nan,             nan,             nan,   7629.50352123,
          10998.64453642,   3599.15462324,   3518.1506015 ,  11032.23373143,
           6437.27912099,  32723.20234422,  52367.41616547,  52720.29473575,
          65635.47315639,  64640.352634  ,  98701.77568606,  81055.95648727,
         121390.37588683, 106668.44146118,  83854.02210337,             nan,
                     nan,             nan])}}