In this notebook, we aim to demonstrate how C-band (4–8 GHz, wavelengths of approximately 3.75–7.5 cm) and L-band (1–2 GHz, wavelengths of approximately 15–30 cm) radio frequencies differ for different land covers and times of the year. In addition, we’ll look at co- and cross-polarized backscattering:
Sentinel-1 (C-band)
VV
VH
Alos-2 (L-band):
HH
HV
import holoviews as hv
import hvplot.xarray  # noqa: F401
import intake
import matplotlib.pyplot as plt
import numpy as npData Loading
We load the data again with the help of intake.
uri = "https://git.geo.tuwien.ac.at/public_projects/microwave-remote-sensing/-/raw/main/microwave-remote-sensing.yml"
cat = intake.open_catalog(uri)
fused_ds = cat.fused.read()
fused_dsThe loaded data contains the Leaf Area Index (LAI), which is used as an estimate of foliage cover of forest canopies. So high LAI is interpreted as forested area, whereas low values account for less vegetated areas (shrubs, grass-land, and crops).
First we’ll have a look at the mean and standard deviation of LAI over all timeslices. This can be achieved by using the mean and std methods of the xarray object and by supplying a dimension over which these aggregating operations will be applied. We use the dimension “time”, thereby flattening the cube to a 2-D array with dimensions x and y.
fig, ax = plt.subplots(1, 2, figsize=(15, 6))

LAI_dc = fused_ds.LAI
LAI_mean = LAI_dc.mean("time")
LAI_std = LAI_dc.std("time")

LAI_mean.plot(ax=ax[0], vmin=0, vmax=6).axes.set_aspect("equal")
LAI_std.plot(ax=ax[1], vmin=0, vmax=3).axes.set_aspect("equal")
plt.tight_layout()
/home/runner/micromamba/envs/eo-datascience-cookbook/lib/python3.13/site-packages/dask/array/numpy_compat.py:61: RuntimeWarning: invalid value encountered in divide
x = np.divide(x1, x2, out)
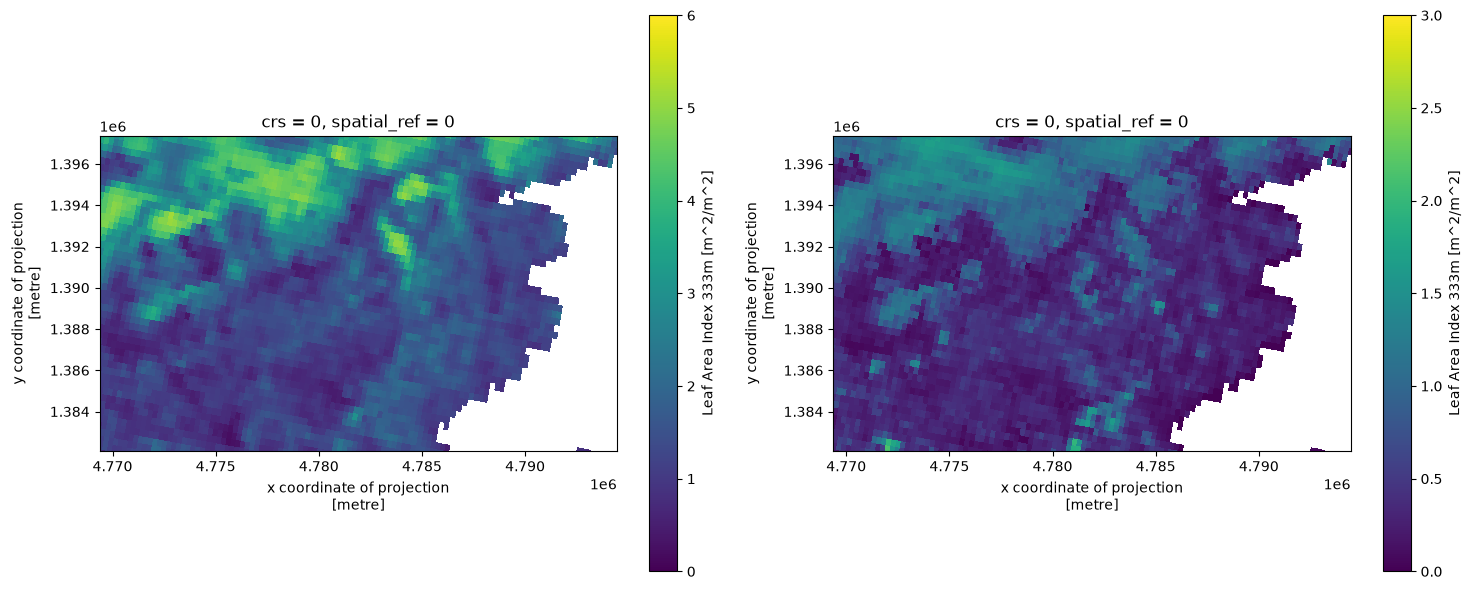
Figure 1: Map of mean LAI (left) and the associated standard deviation (right) for each pixel over time around Lake Garda.
It appears that the northern parts of our study area contain more and variable amounts of green elements per unit area. This might indicate a more complete coverage of foliage and thus forest.
Timeseries
Now that we have detected possible forested areas, let’s delve a bit deeper into the data. Remember that we deal with a spatiotemporal datacube. This gives us the possibility to study changes for each time increment. Hence we can show what happens to LAI for areas marked with generally low values as well as high values. We can achieve this by filtering the datacube with the where method for areas marked with low and high mean LAI values. In turn we will aggregate the remaining datacube over the spatial dimensions (“x” and “y”) to get a mean values for each time increment.
fig, ax = plt.subplots(1, 2, figsize=(15, 4))

LAI_low = LAI_dc.where(LAI_mean < 4)
LAI_high = LAI_dc.where(LAI_mean > 4)

LAI_low.mean(["x", "y"]).plot.scatter(x="time", ax=ax[0], ylim=(0, 6))
LAI_high.mean(["x", "y"]).plot.scatter(x="time", ax=ax[1], ylim=(0, 6))
ax[0].set_title("Low Mean LAI ($\\bar{LAI} < 4$)")
ax[1].set_title("High Mean LAI ($\\bar{LAI} > 4$)")
plt.tight_layout()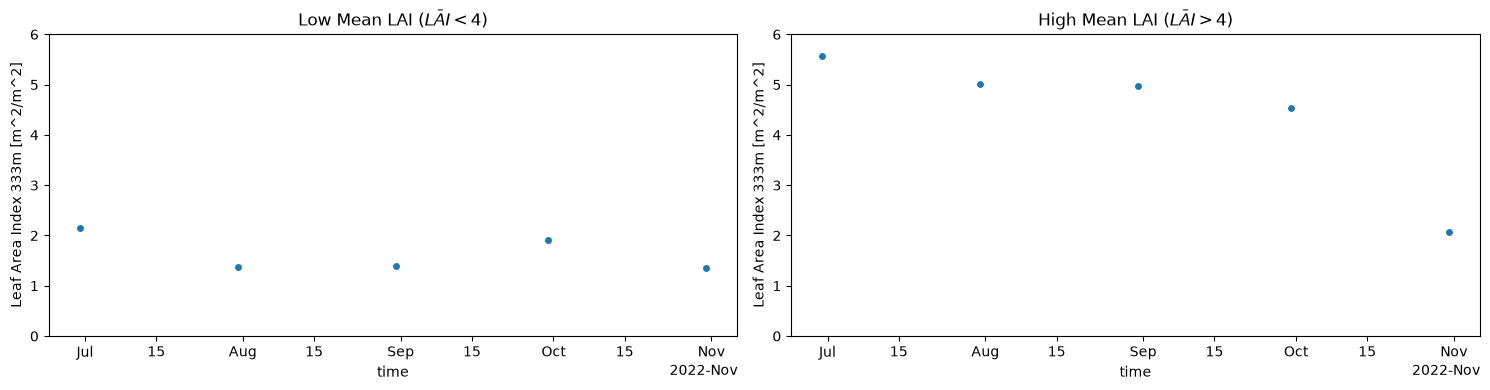
Figure 2: Timeseries of mean LAI per timeslice for areas with low (left) and high (right) mean LAI of Figure1.
Now we can see that areas with high mean LAI values (Figure 1) show a drop-off to values as low as those for areas with low mean LAI during the autumn months (Figure 2 ; right panel). Hence we might deduce that we deal with deciduous forest that becomes less green during autumn, as can be expected for the study area.
Remember that longer wavelengths like L-bands are more likely to penetrate through a forest canopy and would interact more readily with larger object like tree trunks and the forest floor. In turn, C-band microwaves are more likely to interact with sparse and shrub vegetation. The polarization of the emitted and received microwaves is on the other hand dependent on the type of backscattering with co-polarization (HH and VV) happening more frequently with direct backscatter or double bounce scattering. Whereas volume scattering occurs when the radar signal is subject to multiple reflections within 3-dimensional matter, as the orientation of the main scatterers is random, the polarization of the backscattered signal is also random. Volume scattering can therefore cause an increase of cross-polarized intensity.
Let’s put this to the test by checking the microwave backscatter signatures over forested and sparsely vegetated areas as well as water bodies (Lake Garda). Let’s first look at the different sensor readings for the beginning of summer and autumn.
hv.output(widget_location="bottom")

t1 = (
    fused_ds.gam0.isel(time=2)
    .hvplot.image(
        robust=True, data_aspect=1, cmap="Greys_r", rasterize=True, clim=(-25, 0)
    )
    .opts(frame_height=400, aspect="equal")
)

t2 = (
    fused_ds.gam0.isel(time=-1)
    .hvplot.image(
        robust=True, data_aspect=1, cmap="Greys_r", rasterize=True, clim=(-25, 0)
    )
    .opts(frame_height=400, aspect="equal")
)

t1 + t2Figure 3: Maps of Sentinel-1 and Alos-2 for the beginning of summer (left) and autumn (right).
The most notable difference is the lower energy received for cross-polarized than for co-polarized microwaves for both Sentinel-1 and Alos-2. The latter differences are independent of the time of year. However, one can also note small changes in the received energy for the same satellite dependent on the time of year. To get a better feel for these changes over time we generate the following interactive plot. On the following plot one can select areas of a certain mean LAI (by clicking on the map) and see the associated timeseries of for each of the sensors.
LAI_image = LAI_mean.hvplot.image(rasterize=True, cmap="viridis", clim=(0, 6)).opts(
    title="Mean LAI (Selectable)", frame_height=400, aspect="equal"
)


def get_timeseries(x, y):
    """Callback Function Holoviews

    Parameters
    ----------
    x: float
        numeric value for x selected on LAI map
    y: float
        numeric value for y selected on LAI map

    """
    lai_value = LAI_mean.sel(x=x, y=y, method="nearest").values

    if np.isnan(lai_value):
        select = fused_ds.where(LAI_mean.isnull())
        label = "Water"
    else:
        mask = np.isclose(LAI_mean, lai_value, atol=0.05)
        select = fused_ds.where(mask)
        label = "Mean LAI: " + str(np.round(lai_value, 1))

    time_series = (
        select.gam0.to_dataset("sensor")
        .median(["x", "y"], skipna=True)
        .hvplot.scatter(ylim=(-30, 5))
        .opts(title=label, frame_height=400)
    )

    return time_series


point_stream = hv.streams.SingleTap(source=LAI_image)
time_series = hv.DynamicMap(get_timeseries, streams=[point_stream])
LAI_image + time_series
---------------------------------------------------------------------------
KeyError Traceback (most recent call last)
File ~/micromamba/envs/eo-datascience-cookbook/lib/python3.13/site-packages/holoviews/core/dimension.py:1493, in Dimensioned._repr_mimebundle_(self, include, exclude)
1486 def _repr_mimebundle_(self, include=None, exclude=None):
1487 """Resolves the class hierarchy for the class rendering the
1488 object using any display hooks registered on Store.display
1489 hooks. The output of all registered display_hooks is then
1490 combined and returned.
1491
1492 """
-> 1493 return Store.render(self)
File ~/micromamba/envs/eo-datascience-cookbook/lib/python3.13/site-packages/holoviews/core/options.py:1519, in Store.render(cls, obj)
1517 data, metadata = {}, {}
1518 for hook in hooks:
-> 1519 ret = hook(obj)
1520 if ret is None:
1521 continue
File ~/micromamba/envs/eo-datascience-cookbook/lib/python3.13/site-packages/holoviews/ipython/display_hooks.py:330, in pprint_display(obj)
328 if not ip.display_formatter.formatters["text/plain"].pprint:
329 return None
--> 330 return display(obj, raw_output=True)
File ~/micromamba/envs/eo-datascience-cookbook/lib/python3.13/site-packages/holoviews/ipython/display_hooks.py:301, in display(obj, raw_output, **kwargs)
299 elif isinstance(obj, (Layout, NdLayout, AdjointLayout)):
300 with option_state(obj):
--> 301 output = layout_display(obj)
302 elif isinstance(obj, (HoloMap, DynamicMap)):
303 with option_state(obj):
File ~/micromamba/envs/eo-datascience-cookbook/lib/python3.13/site-packages/holoviews/ipython/display_hooks.py:193, in display_hook.<locals>.wrapped(element)
191 try:
192 max_frames = OutputSettings.options["max_frames"]
--> 193 mimebundle = fn(element, max_frames=max_frames)
194 if mimebundle is None:
195 return {}, {}
File ~/micromamba/envs/eo-datascience-cookbook/lib/python3.13/site-packages/holoviews/ipython/display_hooks.py:261, in layout_display(layout, max_frames)
258 max_frame_warning(max_frames)
259 return None
--> 261 return render(layout)
File ~/micromamba/envs/eo-datascience-cookbook/lib/python3.13/site-packages/holoviews/ipython/display_hooks.py:62, in render(obj, **kwargs)
59 if renderer.fig == "pdf":
60 renderer = renderer.instance(fig="png")
---> 62 return renderer.components(obj, **kwargs)
File ~/micromamba/envs/eo-datascience-cookbook/lib/python3.13/site-packages/holoviews/plotting/renderer.py:459, in Renderer.components(self, obj, fmt, comm, **kwargs)
457 embed = not (dynamic or streams or self.widget_mode == "live") or config.embed
458 if embed or config.comms == "default":
--> 459 return self._render_panel(plot, embed, comm)
460 return self._render_ipywidget(plot)
File ~/micromamba/envs/eo-datascience-cookbook/lib/python3.13/site-packages/holoviews/plotting/renderer.py:466, in Renderer._render_panel(self, plot, embed, comm)
464 doc = Document()
465 with config.set(embed=embed):
--> 466 model = plot.layout._render_model(doc, comm)
467 if embed:
468 return render_model(model, comm)
File ~/micromamba/envs/eo-datascience-cookbook/lib/python3.13/site-packages/panel/viewable.py:908, in Viewable._render_model(self, doc, comm)
906 if comm is None:
907 comm = state._comm_manager.get_server_comm()
--> 908 model = self.get_root(doc, comm)
910 if self._design and self._design.theme.bokeh_theme:
911 doc.theme = self._design.theme.bokeh_theme
File ~/micromamba/envs/eo-datascience-cookbook/lib/python3.13/site-packages/panel/layout/base.py:386, in Panel.get_root(self, doc, comm, preprocess)
382 def get_root(
383 self, doc: Document | None = None, comm: Comm | None = None,
384 preprocess: bool = True
385 ) -> Model:
--> 386 root = super().get_root(doc, comm, preprocess)
387 # ALERT: Find a better way to handle this
388 if hasattr(root, 'styles') and 'overflow-x' in root.styles:
File ~/micromamba/envs/eo-datascience-cookbook/lib/python3.13/site-packages/panel/viewable.py:820, in Renderable.get_root(self, doc, comm, preprocess)
818 wrapper = self._design._wrapper(self)
819 if wrapper is self:
--> 820 root = self._get_model(doc, comm=comm)
821 if preprocess:
822 self._preprocess(root)
File ~/micromamba/envs/eo-datascience-cookbook/lib/python3.13/site-packages/panel/layout/base.py:370, in Panel._get_model(self, doc, root, parent, comm)
368 root = root or model
369 self._models[root.ref['id']] = (model, parent)
--> 370 objects, _ = self._get_objects(model, [], doc, root, comm)
371 props = self._get_properties(doc)
372 props[self._property_mapping['objects']] = objects
File ~/micromamba/envs/eo-datascience-cookbook/lib/python3.13/site-packages/panel/layout/base.py:352, in Panel._get_objects(self, model, old_objects, doc, root, comm)
350 else:
351 try:
--> 352 child = pane._acquire_model(doc, root, model, comm)
353 except RerenderError as e:
354 if e.layout is not None and e.layout is not self:
File ~/micromamba/envs/eo-datascience-cookbook/lib/python3.13/site-packages/panel/viewable.py:686, in Renderable._acquire_model(self, doc, root, parent, comm)
684 parents = self._model_parents.setdefault(ref, [owner])
685 else:
--> 686 model = self._get_model(doc, root, parent, comm)
687 parents = self._model_parents.setdefault(ref, [])
688 if not any(p is parent for p in parents):
File ~/micromamba/envs/eo-datascience-cookbook/lib/python3.13/site-packages/panel/pane/holoviews.py:497, in HoloViews._get_model(self, doc, root, parent, comm)
495 plot = self.object
496 else:
--> 497 plot = self._render(doc, comm, root)
499 plot.pane = self
500 backend = plot.renderer.backend
File ~/micromamba/envs/eo-datascience-cookbook/lib/python3.13/site-packages/panel/pane/holoviews.py:591, in HoloViews._render(self, doc, comm, root)
588 if comm:
589 kwargs['comm'] = comm
--> 591 return renderer.get_plot(self.object, **kwargs)
File ~/micromamba/envs/eo-datascience-cookbook/lib/python3.13/site-packages/holoviews/plotting/bokeh/renderer.py:77, in BokehRenderer.get_plot(self_or_cls, obj, doc, renderer, **kwargs)
70 @bothmethod
71 def get_plot(self_or_cls, obj, doc=None, renderer=None, **kwargs):
72 """Given a HoloViews Viewable return a corresponding plot instance.
73 Allows supplying a document attach the plot to, useful when
74 combining the bokeh model with another plot.
75
76 """
---> 77 plot = super().get_plot(obj, doc, renderer, **kwargs)
78 if plot.document is None:
79 plot.document = Document() if self_or_cls.notebook_context else curdoc()
File ~/micromamba/envs/eo-datascience-cookbook/lib/python3.13/site-packages/holoviews/plotting/renderer.py:278, in Renderer.get_plot(self_or_cls, obj, doc, renderer, comm, **kwargs)
275 raise SkipRendering(msg.format(dims=dims))
277 # Initialize DynamicMaps with first data item
--> 278 initialize_dynamic(obj)
280 if not renderer:
281 renderer = self_or_cls
File ~/micromamba/envs/eo-datascience-cookbook/lib/python3.13/site-packages/holoviews/plotting/util.py:287, in initialize_dynamic(obj)
285 continue
286 if not len(dmap):
--> 287 dmap[dmap._initial_key()]
File ~/micromamba/envs/eo-datascience-cookbook/lib/python3.13/site-packages/holoviews/core/spaces.py:1368, in DynamicMap.__getitem__(self, key)
1366 if cache is not None:
1367 return cache
-> 1368 val = self._execute_callback(*tuple_key)
1369 if data_slice:
1370 val = self._dataslice(val, data_slice)
File ~/micromamba/envs/eo-datascience-cookbook/lib/python3.13/site-packages/holoviews/core/spaces.py:1118, in DynamicMap._execute_callback(self, *args)
1115 kwargs["_memoization_hash_"] = hash_items
1117 with dynamicmap_memoization(self.callback, self.streams):
-> 1118 retval = self.callback(*args, **kwargs)
1119 return self._style(retval)
File ~/micromamba/envs/eo-datascience-cookbook/lib/python3.13/site-packages/holoviews/core/spaces.py:675, in Callable.__call__(self, *args, **kwargs)
672 args, kwargs = (), dict(pos_kwargs, **kwargs)
674 try:
--> 675 ret = self.callable(*args, **kwargs)
676 except KeyError:
677 # KeyError is caught separately because it is used to signal
678 # invalid keys on DynamicMap and should not warn
679 raise
Cell In[6], line 17, in get_timeseries(x, y)
13 y: float
14 numeric value for y selected on LAI map
15
16 """
---> 17 lai_value = LAI_mean.sel(x=x, y=y, method="nearest").values
18
19 if np.isnan(lai_value):
20 select = fused_ds.where(LAI_mean.isnull())
File ~/micromamba/envs/eo-datascience-cookbook/lib/python3.13/site-packages/xarray/core/dataarray.py:1729, in DataArray.sel(self, indexers, method, tolerance, drop, **indexers_kwargs)
1613 def sel(
1614 self,
1615 indexers: Mapping[Any, Any] | None = None,
(...) 1619 **indexers_kwargs: Any,
1620 ) -> Self:
1621 """Return a new DataArray whose data is given by selecting index
1622 labels along the specified dimension(s).
1623
(...) 1727 Dimensions without coordinates: points
1728 """
-> 1729 ds = self._to_temp_dataset().sel(
1730 indexers=indexers,
1731 drop=drop,
1732 method=method,
1733 tolerance=tolerance,
1734 **indexers_kwargs,
1735 )
1736 return self._from_temp_dataset(ds)
File ~/micromamba/envs/eo-datascience-cookbook/lib/python3.13/site-packages/xarray/core/dataset.py:3073, in Dataset.sel(self, indexers, method, tolerance, drop, **indexers_kwargs)
3069 Tutorial material on basics of indexing
3070
3071 """
3072 indexers = either_dict_or_kwargs(indexers, indexers_kwargs, "sel")
-> 3073 query_results = map_index_queries(
3074 self, indexers=indexers, method=method, tolerance=tolerance
3075 )
3076
File ~/micromamba/envs/eo-datascience-cookbook/lib/python3.13/site-packages/xarray/core/indexing.py:219, in map_index_queries(obj, indexers, method, tolerance, **indexers_kwargs)
217 results.append(IndexSelResult(labels))
218 else:
--> 219 results.append(index.sel(labels, **options))
221 merged = merge_sel_results(results)
223 # drop dimension coordinates found in dimension indexers
224 # (also drop multi-index if any)
225 # (.sel() already ensures alignment)
File ~/micromamba/envs/eo-datascience-cookbook/lib/python3.13/site-packages/xarray/core/indexes.py:875, in PandasIndex.sel(self, labels, method, tolerance)
873 indexer = get_indexer_nd(self.index, label_array, method, tolerance)
874 if np.any(indexer < 0):
--> 875 raise KeyError(f"not all values found in index {coord_name!r}")
876 else:
877 try:
KeyError: "not all values found in index 'x'":Layout
.DynamicMap.I :DynamicMap []
:Image [x,y] (Leaf Area Index 333m)
.DynamicMap.II :DynamicMap []Figure 4: Map of MEAN LAI around Lake Garda. The pixel values can be seen by hovering your mouse over the pixels. Clicking on the pixel will generate the timeseries for the associated mean LAI on the right hand-side. (Right) Timeseries of for Sentinel-1 and Alos-2 .
Can you see some patterns when analyzing the different wavelengths and polarizations?
Remember again that we deal with a logarithmic scale. A measurement of 10 dB is 10 times brighter than the intensity measured at 0 dB, and 100 times brighter at 20 dB. The most notable difference is that the offset between cross- and co-polarised signals becomes larger at low LAI and lower at higher LAI. This might indicate the effect of volume scattering in forested areas where co- and cross-polarization render backscattering values more equal. You will study the differences among cross- and co-polarized backscattering in more detail in the homework exercise.