HEALPix Overview
This first section of the cookbook aims at providing the reader with an introduction to Hierarchical Equal Area isoLatitude Pixelation (HEALPix). However, rather than duplicating tons of information that is already available at HEALPix resources, we will try guiding the Pythia’s community in the right direction to access those resources.
In this section, you’ll learn:
What is HEALPix?
What resources can lead you to learn more about HEALPix?
Why HEALPix?
Prerequisites
Concepts |
Importance |
Notes |
|---|---|---|
Helpful |
Time to learn: 10 minutes
What is HEALPix?
HEALPix is a high resolution discretization framework to provide equal area, iso-Latitude pixelation of a sphere for fast analysis of data distributed on it, which produces a subdivision of the spherical surface in which each pixel covers the same surface area as every other pixel at a given resolution level.
HEALPix was originally devised to support fast and accurate mathematical calculations on a spherical discretization at sufficiently high resolution levels for satellite missions to measure the cosmic microwave background (CMB), and it has later been adopted to geoscience applications as well.
Be sure to check out the HEALPix home page and the References at the end of this section for further details.
Why HEALPix?
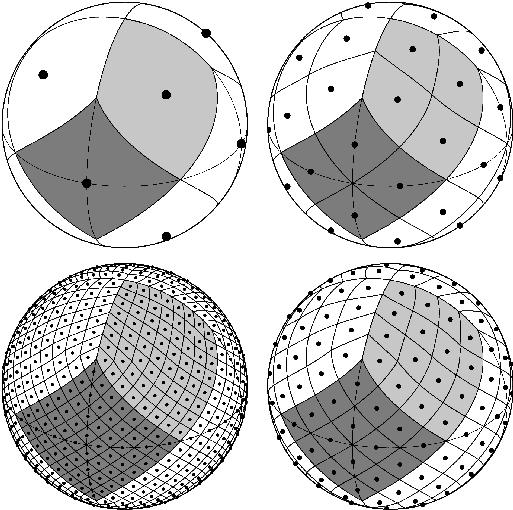
Three key features of HEALPix are:
The sphere is hierarchically tessellated into curvilinear quadrilaterals
Areas of all pixels at a given resolution are identical
Pixels are distributed on lines of constant latitude
These properties make HEALPix a good gridding choice to facilitate fast and accurate statistical and spherical analysis for high-resolution data such as spherical harmonics.
Where to learn more about HEALPix?
In addition to the Related Documentation provided in the beginning of this notebook, there are some good resources that you can further learn HEALPix through. In this part, we’d like to introduce one of them, easy.gems:
easy.gems
DKRZ (The German Climate Computing Center) created easy.gems for documenting high-resolution climate simulation output and its analysis, which was started within the frame of the DYAMOND intercomparison initiative.
Since output in multiple resolutions (hierarchical) is written on the HEALPix grid in order to simplify and speed up analysis, easy.gems provides documentation for a range of applications such as getting started with HEALPix, using HEALPix analysis and plotting functionality on the simulation data, and performing conversions between HEALPix and other grid types.
The next section will showcase an easy.gems workflow that loads in, manipulates, analyzes, and visualizes HEALpix data, which uses easy.gems functions and other scientific Python ecosystem packages’ functionality recommended by easy.gems.
References
What is next?
The next section will provide an easy.gems workflow that uses HEALPix data.