MPAS Viewer
What is MPAS-A?
The Model for Prediction Across Scales Atmosphere (MPAS-A) is an atmospheric model designed to represent weather systems across a wide range of spatial scales. Its defining feature is a variable-resolution mesh that allows regions of interest to be simulated at higher resolution while maintaining a coarser resolution elsewhere. This flexibility helps MPAS-A capture both large-scale atmospheric patterns and smaller-scale weather features.
Why is Visualization Challenging?
While the MPAS mesh gives the model a lot of flexibility, it also makes visualization more challenging. Unlike traditional gridded datasets, MPAS-A output does not fit neatly into a regular latitude-longitude grid. This means that common plotting workflows often require extra steps to properly handle the mesh structure.
Why MPAS Viewer?
MPAS Viewer was developed to make this process easier. It provides tools and workflows for exploring MPAS-A output, creating visualizations, and working with model data without needing to focus as much on the details of the underlying mesh.
Why use MPAS Viewer?
MPAS Viewer helps users quickly inspect simulations, visualize unstructured mesh data, create figures, generate animations, and build reproducible workflows.
Why MPAS Instead of WRF?
WRF is one of the most widely used atmospheric models and remains an important tool for weather research and forecasting. However, MPAS-A was designed to address some challenges that can arise when modeling weather systems across large domains and multiple spatial scales.
One major difference is the grid structure. WRF commonly uses a structured latitude-longitude grid, while MPAS-A uses an unstructured Voronoi mesh. In simple terms, a Voronoi mesh divides the model domain into mostly hexagonal cells, creating a flexible “honeycomb-like” grid that can smoothly vary in size across the globe. This mesh allows MPAS-A to avoid issues near the poles and scale efficiently on large computing systems.
Another key difference is how each model handles higher-resolution regions. In WRF, increased resolution is usually added through nested domains, which can create abrupt transitions at nest boundaries. MPAS-A uses smooth grid refinement, allowing resolution to gradually change across the domain without sharp boundaries.
This makes MPAS-A especially useful for simulations where both large-scale atmospheric flow and smaller-scale weather features are important. Instead of choosing between a global view and regional detail, MPAS-A provides a framework for representing both in the same simulation.
| WRF | MPAS-A |
|---|---|
| Structured latitude-longitude grid | Unstructured Voronoi mesh |
| Uses nested domains for higher resolution | Uses smooth variable-resolution refinement |
| Can have abrupt nest boundaries | Allows gradual resolution transitions |
| Strong choice for many regional applications | Strong choice for global-to-regional applications |
Big picture: WRF and MPAS-A are both valuable atmospheric models, but MPAS-A is especially useful when the goal is to smoothly connect global-scale flow with regional or storm-scale features.
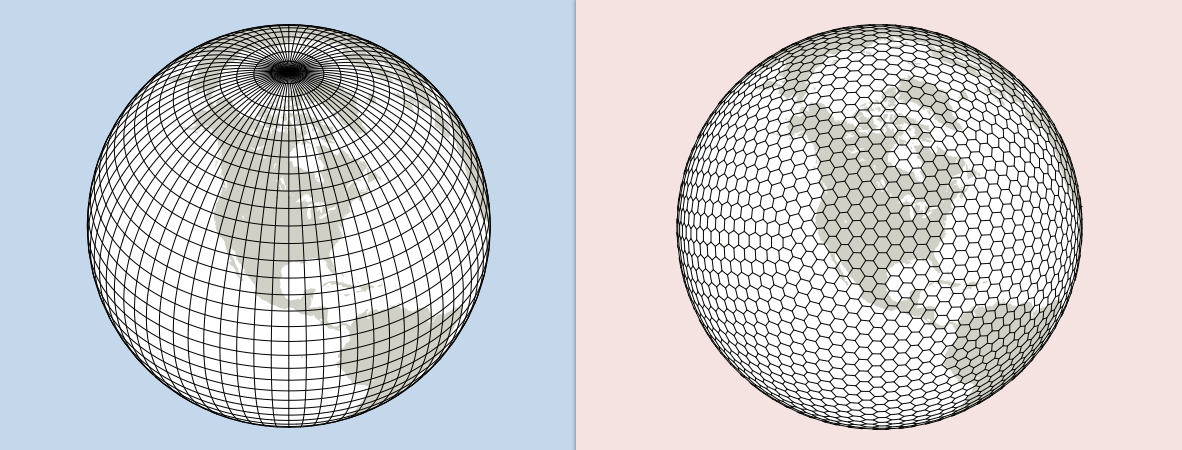
This difference in grid structure is one of the main reasons MPAS-A is powerful, but it is also why visualizing MPAS-A output requires a slightly different approach.I’m a little more tight on time than I was two months ago. That said, would we do something hosted by AMS at their building? Or would we make it an unofficial thing at a coffee shop? I couldn’t pay them, so it’d have to be word of mouth type thing and hopefully they wouldn’t get upset and instead would appreciate the business lol.
Figure 1. Comparison of WRF and MPAS grid structures. WRF uses a structured latitude-longitude grid, while MPAS uses an unstructured Voronoi/hexagonal mesh that avoids pole problems and supports efficient global modeling. Source: MPAS for WRF Users, slide 5.
What You’ll Learn
By working through this cookbook, you will learn how to:
learn how to read in datasets
create visualizations
generate animations from model data