Kerchunk, hvPlot, and Datashader: Visualizing datasets on-the-fly
Overview
This notebook will demonstrate how to use Kerchunk with hvPlot and Datashader to lazily visualize a reference dataset in a streaming fashion.
We will be building off content from Kerchunk and Pangeo-Forge, so it’s encouraged you first go through that.
Prerequisites
Concepts |
Importance |
Notes |
|---|---|---|
Kerchunk Basics |
Required |
Core |
Multiple Files and Kerchunk |
Required |
Core |
Required |
IO |
|
Required |
Data Visualization |
|
Required |
Big Data Visualization |
Time to learn: 10 minutes
Motivation
Using Kerchunk, we don’t have to create a copy of the data–instead we create a collection of reference files, so that the original data files can be read as if they were Zarr.
This enables visualization on-the-fly; simply pass in the URL to the dataset and use hvplot.
Getting to Know The Data
gridMET is a high-resolution daily meteorological dataset covering CONUS from 1979-2023. It is produced by the Climatology Lab at UC Merced. In this example, we are going to look create a virtual Zarr dataset of a derived variable, Burn Index.
Imports
import os
import time

import apache_beam as beam
import fsspec
import hvplot.xarray
import xarray as xr
from pangeo_forge_recipes.patterns import ConcatDim, FilePattern
from pangeo_forge_recipes.transforms import (
    OpenWithKerchunk,
    WriteCombinedReference,
)
Preprocess Dataset
Here we will be preparing the Kerchunk reference files by using the recipe described in Kerchunk and Pangeo-Forge.
# Constants
target_root = "references"
store_name = "Pangeo_Forge"
full_path = os.path.join(target_root, store_name, "reference.json")
years = list(range(1979, 1980))
time_dim = ConcatDim("time", keys=years)


# Functions
def format_function(time):
    return f"http://www.northwestknowledge.net/metdata/data/bi_{time}.nc"


# Patterns
pattern = FilePattern(format_function, time_dim, file_type="netcdf4")
pattern = pattern.prune()

# Apache Beam transforms
transforms = (
    beam.Create(pattern.items())
    | OpenWithKerchunk(file_type=pattern.file_type)
    | WriteCombinedReference(
        target_root=target_root,
        store_name=store_name,
        concat_dims=["day"],
        identical_dims=["lat", "lon", "crs"],
    )
)
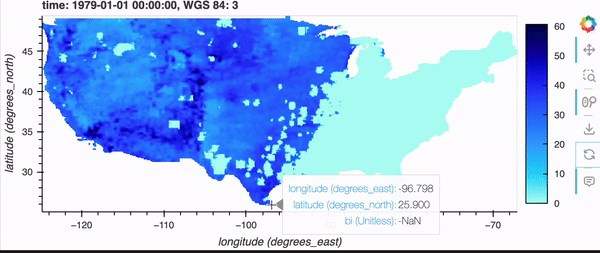
Opening the Kerchunk Dataset
Now, it’s a matter of opening the Kerchunk dataset and calling hvplot with the rasterize=True keyword argument.
If you’re running this notebook locally, try zooming around the map by hovering over the plot and scrolling; it should update fairly quickly. Note, it will not update if you’re viewing this on the docs page online as there is no backend server, but don’t fret because there’s a demo GIF below!
%%timeit -r 1 -n 1

mapper = fsspec.get_mapper(
    "reference://",
    fo=full_path,
    remote_protocol="http",
)
ds_kerchunk = xr.open_dataset(
    mapper, engine="zarr", decode_coords="all", backend_kwargs={"consolidated": False}
)
display(ds_kerchunk.hvplot("lon", "lat", rasterize=True))
4.39 s ± 0 ns per loop (mean ± std. dev. of 1 run, 1 loop each)
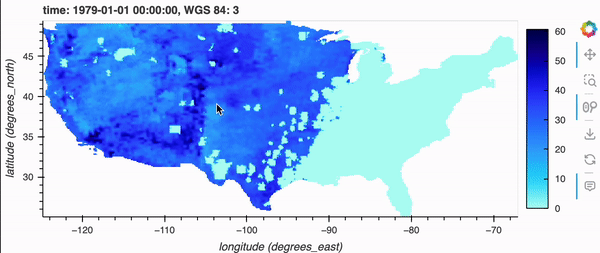
Comparing Against THREDDS
Now, we will be repeating the previous cell, but with THREDDS.
Note how the initial load is longer.
If you’re running the notebook locally (or a demo GIF below), zooming in/out also takes longer to finish buffering as well.
%%timeit -r 1 -n 1


def url_gen(year):
    return (
        f"http://thredds.northwestknowledge.net:8080/thredds/dodsC/MET/bi/bi_{year}.nc"
    )


urls_list = [url_gen(year) for year in years]
netcdf_ds = xr.open_mfdataset(urls_list, engine="netcdf4")
display(netcdf_ds.hvplot("lon", "lat", rasterize=True))
4.62 s ± 0 ns per loop (mean ± std. dev. of 1 run, 1 loop each)