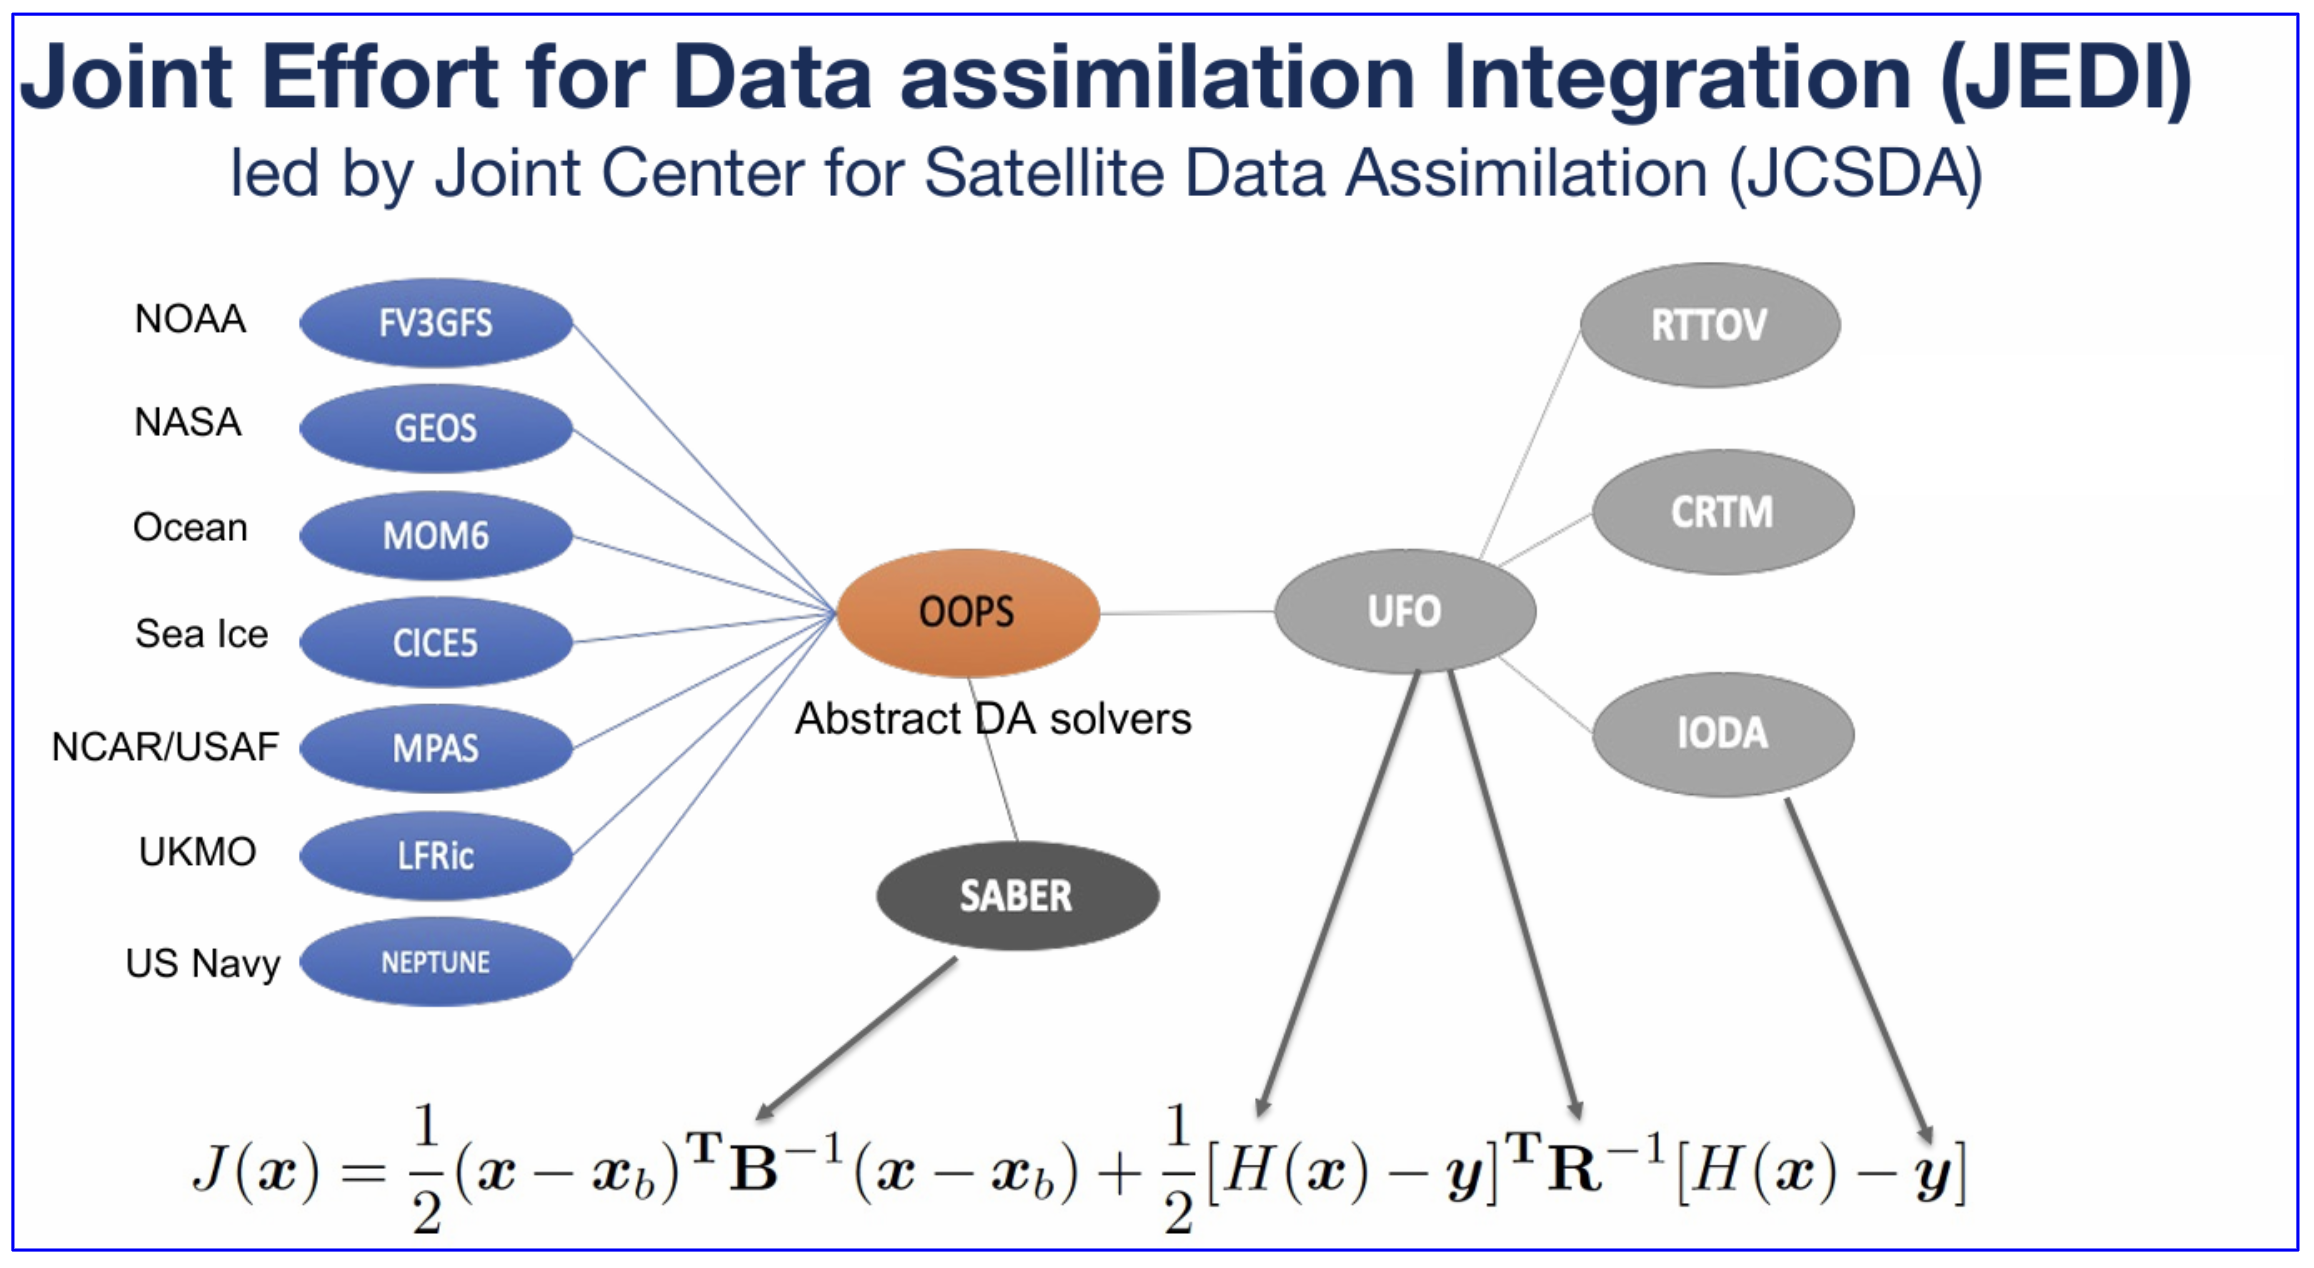
In this section, you’ll learn:
Utilizing UXarry to compute analysis increments, visualize increments in horizontal and vertical cross sections
Prerequisites
| Concepts | Importance | Notes |
|---|---|---|
| Atmospheric Data Assimilation | Helpful |
Time to learn: 10 minutes
Readers may check pyDAmonitor for more information
Import packages
%%time

# autoload external python modules if they changed
%load_ext autoreload
%autoreload 2

# add ../funcs to the current path
import sys, os
sys.path.append(os.path.join(os.getcwd(), ".."))

# import modules
import warnings
import math

import cartopy.crs as ccrs
import geoviews as gv
import geoviews.feature as gf
import holoviews as hv
import hvplot.xarray
from holoviews import opts
import matplotlib as mpl
import matplotlib.pyplot as plt
from matplotlib.colors import ListedColormap

import s3fs

import geopandas as gp
import numpy as np
import uxarray as ux
import xarray as xr
CPU times: user 310 ms, sys: 58.2 ms, total: 368 ms
Wall time: 292 ms
---------------------------------------------------------------------------
ModuleNotFoundError                       Traceback (most recent call last)
Cell In[1], line 1
----> 1 get_ipython().run_cell_magic('time', '', '\n# autoload external python modules if they changed\n%load_ext autoreload\n%autoreload 2\n\n# add ../funcs to the current path\nimport sys, os\nsys.path.append(os.path.join(os.getcwd(), "..")) \n\n# import modules\nimport warnings\nimport math\n\nimport cartopy.crs as ccrs\nimport geoviews as gv\nimport geoviews.feature as gf\nimport holoviews as hv\nimport hvplot.xarray\nfrom holoviews import opts\nimport matplotlib as mpl\nimport matplotlib.pyplot as plt\nfrom matplotlib.colors import ListedColormap\n\nimport s3fs\n\nimport geopandas as gp\nimport numpy as np\nimport uxarray as ux\nimport xarray as xr\n')

File <timed exec>:14

ModuleNotFoundError: No module named 'geoviews'
Configure visualization tools
hv.extension("bokeh")
# hv.extension("matplotlib")

# common border lines
coast_lines = gf.coastline(projection=ccrs.PlateCarree(), line_width=1, scale="50m")
state_lines = gf.states(projection=ccrs.PlateCarree(), line_width=1, line_color='gray', scale="50m")
Retrieve/load MPAS/JEDI data
The example MPAS/JEDI data are stored at jetstream2. We need to retreive those data first.
There are two ways to retrieve MPAS data:
Download all example data from JetStream2 to local and them load them locally. This approach allows downloading the data once per machine and reuse it in notebooks.
Stream the JetStream2 S3 objects on demand. In this case, each notebook (including restarting a notebook) will retrieve the required data separately as needed.
# choose the data_load_method, check the above cell for details. Default to method 1, i.e. download once and reuse it in multiple notebooks
data_load_method = 2  # 1 or 2
Method 1: Download all example data once and reuse it in mulptile notebooks
%%time
local_dir="/tmp"

if data_load_method == 1 and not os.path.exists(local_dir + "/conus12km/bkg/mpasout.2024-05-06_01.00.00.nc"):
    jetstream_url = 'https://js2.jetstream-cloud.org:8001/'
    fs = s3fs.S3FileSystem(anon=True, asynchronous=False,client_kwargs=dict(endpoint_url=jetstream_url))
    conus12_path = 's3://pythia/mpas/conus12km'
    fs.get(conus12_path, local_dir, recursive=True)
    print("Data downloading completed")
else:
    print("Skip..., either data is available in local or data_load_method is NOT 1")
# Set file path
if data_load_method == 1:
grid_file = local_dir + "/conus12km/conus12km.invariant.nc_L60_GFS"
ana_file = local_dir + "/conus12km/bkg/mpasout.2024-05-06_01.00.00.nc"
bkg_file = local_dir + "/conus12km/ana/mpasout.2024-05-06_01.00.00.nc"Method 2: Stream the JetStream2 S3 objects on demand
%%time
if data_load_method == 2:
    jetstream_url = 'https://js2.jetstream-cloud.org:8001/'
    fs = s3fs.S3FileSystem(anon=True, asynchronous=False,client_kwargs=dict(endpoint_url=jetstream_url))
    conus12_path = 's3://pythia/mpas/conus12km'

    grid_url=f"{conus12_path}/conus12km.invariant.nc_L60_GFS"
    bkg_url=f"{conus12_path}/bkg/mpasout.2024-05-06_01.00.00.nc"
    ana_url=f"{conus12_path}/ana/mpasout.2024-05-06_01.00.00.nc"

    grid_file = fs.open(grid_url)
    ana_file = fs.open(ana_url)
    bkg_file = fs.open(bkg_url)
else:
print("Skip..., data_load_method is NOT 2")Loading the data into UXarray datasets
We use the UXarray data structures for working with the data. This package supports data defined over unstructured grid and provides utilities for modifying and visualizing it. The available fucntionality are discussed in UxDataset documentation.
uxds_a = ux.open_dataset(grid_file, ana_file)
uxds_b = ux.open_dataset(grid_file, bkg_file)
Compute the analysis increments from the JEDI data assimilation
JEDI updates the background atmospheric state (uxds_b) with observation innovations and gets a new atmospheric state called analysis (uxds_a).
The difference of uxds_a - uxds_b is called “analysis increments”
var_name = "theta"
uxdiff0 = uxds_a[var_name] - uxds_b[var_name]
uxvar = uxdiff0
Horizontal cross sections of analysis increments at different vertical levels
define hcross_contour(..) and customize contour levels and color maps
# contour horizontal cross sections
def hcross_contour(ux_hcross, title, cmin=None, cmax=None, width=800, height=500, clevs=20, cmap="coolwarm",
                   symmetric_cmap=False, colorbar=True):
    # Get min and max
    amin = ux_hcross.min().item()
    amax = ux_hcross.max().item()
    title += f" min={amin:.1f} max={amax:.1f}"
    cmin = math.floor(amin) if cmin is None else cmin
    cmax = math.ceil(amax) if cmax is None else cmax
    if symmetric_cmap:  # to get a symmetric color map when cmin < 0, cmax >0
        cmax = max(abs(cmin), cmax)
        cmin = -cmax

    if isinstance(cmap, str):
        cmap = plt.get_cmap(cmap)

    # generate contour plot
    contour_plot = hv.operation.contours(
        ux_hcross.plot(),
        levels=np.linspace(cmin, cmax, num=clevs),  # levels=np.arange(cmin, cmax, 0.5)
        filled=True
    ).opts(
        line_color=None,  # line_width=0.001
        width=width, height=height,
        cmap=cmap,
        clim=(cmin, cmax),
        colorbar=colorbar,  # cmap="inferno"
        show_legend=False, tools=['hover'], title=title,
    )

    return contour_plot


from matplotlib.colors import ListedColormap, BoundaryNorm, to_rgba
edges = [-4, -3.5, -3, -2.5, -2, -1.5, -1, -0.5, 0, 0.5, 1.0, 1.5, 2, 2.5, 3, 3.5, 4]
colors = [
    "#313695",  # [-4,-3.5]
    "#3f72b4",  # [-3.5,-3]
    "#5a9bd5",  # [-3,-2.5]
    "#81bfe0",  # [-2.5,-2]
    "#a6d8e7",  # [-2,-1.5]
    "#cae6ef",  # [-1.5,-1]
    "#e4f1f5",  # [-1,-0.5]
    "#f2f9fc",  # [-0.5,-0.1]  ← slightly pale blue
    "#fcf2f2",  # [0.1,0.5]     ← slightly pale pink
    "#f9d6d4",  # [0.5,1.0]
    "#f5b5b1",  # [1.0,1.5]
    "#ee8a85",  # [1.5,2.0]
    "#e75e5a",  # [2.0,2.5]
    "#d73027",  # [2.5,3.0]
    "#a50026",  # [3.0,3.5]
    "#67001f",   # [3.5,4.0]
]
cmap = ListedColormap(colors)
plot analysis increments at different vertical levels
%%time

nt=0  # time dimension
plot_levels = [0, 19, 29, 39, 42, 49, 58]  # [0, 29, 42]  # [0, 19, 29, 39, 49, 58]

zero_shift = 0.0

plots = []
for lev in plot_levels:
    dat = uxvar.isel(Time=nt, nVertLevels=lev)
    tmp = hcross_contour(
        dat.where((dat > 0.1) | (dat < -0.1)),
        title=f'lev={lev}',
        cmap=cmap,
        colorbar=True,
        cmax=4,
        cmin=-4
    )

    plots.append(tmp * coast_lines * state_lines)
from IPython.display import display, Markdown

display(Markdown(
    r"**Small increments** $\left[ -0.1 \ \text{to} \ 0.1 \right]$ **neglected**  <br>"
    r"Indicated in white spaces"
))
for p in plots:
   display(p)
Zoomed into Colorado using the subset capability
%%time

lon_center = -105.03
lat_center = 39.0
lon_incr = 5 # degree
lat_incr = 3 # degree
lon_bounds = (lon_center - lon_incr, lon_center + lon_incr)
lat_bounds = (lat_center - lat_incr, lat_center + lat_incr)

### subset to a small domain
uxdiff1 = uxdiff0.subset.bounding_box(lon_bounds, lat_bounds,)
uxvar = uxdiff1


nt=0  # time dimension
plot_levels = [0, 29, 42]  # [0, 19, 29, 39, 49, 58]

plots = []
for lev in plot_levels:
    tmp = hcross_contour(uxvar.isel(Time=nt, nVertLevels=lev), title=f'lev={lev}', width=700, height=500)  # for the subdomain

    # overlay state_lines
    plots.append(tmp * coast_lines * state_lines)

# each plot has its own toolbar, which facilitates controlling each plot individually
for p in plots:
   display(p)
Vertical cross sections of analysis increments along an arbitary line (Great Circle Arc, GCA), a constnat laitude/longigutde
Along an arbitary line ( Great Circle Arc, GCA)
start_point = (-110, 20)
end_point = (-70, 50)

var_name = "theta"
uxdiff0 = uxds_a[var_name].isel(Time=0) - uxds_b[var_name].isel(Time=0)
uxvar = uxdiff0
cross_section_gca = uxvar.cross_section(start=start_point, end=end_point, steps=100)

hlabelticks = [
    f"{abs(lat):.1f}°{'N' if lat >= 0 else 'S'}\n{abs(lon):.1f}°{'E' if lon >= 0 else 'W'}"
    for lat, lon in zip(cross_section_gca['lat'], cross_section_gca['lon'])
]
%matplotlib inline
fig= plt.figure(figsize=(8,3))
gs= fig.add_gridspec(1,1)
ax = fig.add_subplot(gs[0,0])
cf=ax.contourf(cross_section_gca.transpose(),cmap='coolwarm',extend='both')
tick_stride = 10
ax.set_xticks(cross_section_gca['steps'][::tick_stride])
ax.set_xticklabels(hlabelticks[::tick_stride])Along a constant longitude
lon=-83.3
cross_section = uxvar.cross_section(lon=lon, steps=100)

hlabelticks = [
    f"{abs(lat):.1f}°{'N' if lat >= 0 else 'S'}" for lat in cross_section['lat']
]

%matplotlib inline
fig= plt.figure(figsize=(8,3))
gs= fig.add_gridspec(1,1)
ax = fig.add_subplot(gs[0,0])
cf=ax.contourf(cross_section.transpose(),cmap='coolwarm',extend='both')

ax.set_xticks(cross_section['steps'][::tick_stride])
ax.set_xticklabels(hlabelticks[::tick_stride])
Along a constant latitude
lat=42.3
cross_section = uxvar.cross_section(lat=lat, steps=100)

hlabelticks = [
    f"{abs(lon):.1f}°{'E' if lon >= 0 else 'W'}" for lon in cross_section['lon']
]

%matplotlib inline
fig= plt.figure(figsize=(8,3))
gs= fig.add_gridspec(1,1)
ax = fig.add_subplot(gs[0,0])
cf=ax.contourf(cross_section.transpose(),cmap='coolwarm',extend='both')

ax.set_xticks(cross_section['steps'][::tick_stride])
ax.set_xticklabels(hlabelticks[::tick_stride])