
METAR Local Statistics Notebook
This chapter walks you through the request and access of local METeorological Aerodrome Report (METAR) data from dynamical.org, a climatological analysis using your station’s full data record, and challenges the user to analyze meteorological patterns and trends using the tools provided. This notebook will leave you with organized plots and a greater understanding of your region’s climatological trends.
Purpose
To provide hands-on experience in requesting and working with near real-time METAR data from Dynamical.org.
Audience
Users with at least 5 GB of memory in their computing environment. No programming experience is necessary to run the notebook, but a basic knowledge of Python (especially pandas and matplotlib) will help you apply these skills!
Expected Outcome
By the end of this chapter, you will have produced numerous climatological plots that analyze all available METAR records from within 20 miles of your requested location. If you wish to continue working with near real-time METAR data beyond this notebook, there are two bonus challenges at the end of the notebook that encourage the user to further apply their skills.
Estimated Time
5 minutes — Run the notebook and review the code.
15 minutes — Build enough familiarity to reproduce the workflow independently and create your own plots.
45 minutes — Complete the bonus challenges and feel comfortable working with METAR data in Python.
📦 Imports
import duckdb
from datetime import datetime
import pandas as pd
import numpy as np
import matplotlib.pyplot as plt
import matplotlib.dates as mdates
from datetime import date
import requests
from geopy.geocoders import Nominatim
from geopy.distance import geodesic
import sys
from timezonefinder import TimezoneFinder
import pytz
✈️ About METAR
METAR is a format for weather reporting that is predominantly used for pilots and meteorologists (weather.gov). These reports are taken hourly and include the following meteorological variables: temperature, dewpoint, relative humidity, wind direction, wind speed, wind gusts, mean sea level pressure, visibility, and precipitation total. The information is provided in a single line of text (seen below), but has been transformed into a more readable format.
METAR example: LBBG 041600Z 12012MPS 090V150 1400 R04/P1500N R22/P1500U +SN BKN022 OVC050 M04/M07 Q1020 NOSIG 8849//91
💻 About dynamical.org
dynamical.org is a not-for-profit organization with a mission to advance humanity’s ability to access, understand, and act on accurate weather and climate data. They increase accessability to these datasets by providing them in Analysis-Ready Cloud-Optimized (ARCO) format, allowing for quicker startup times and more efficient scientific exploration. Their (Global Airport Observations) dataset is an experimental product retrieved from the Iowa Environmental Mesonet and provided in GeoParquet format.
📌 Location query
This section of the notebook uses the Python package ‘geopy’ to take in a user-requested geographic location and return a corresonding lat/lon point. Then, the code requests all lat/lon points associated with an ASOS station from the database hosted by dynamical.org, locates the closest station (within 20 miles), and procures all historical ASOS observations for that site.
# Select the geographic location of interest using geopy
# (uncomment the input cell when using the notebook interactively)
ASOS_location = "Sioux Falls"
#ASOS_location = input(f"Enter a location (city, address, etc.):")
geolocator = Nominatim(user_agent="asos_finder")
requested_location = geolocator.geocode(ASOS_location)

# Determine local timezone from the queried coordinates
timezone_str = TimezoneFinder().timezone_at(lat=requested_location.latitude, lng=requested_location.longitude)
local_tz = pytz.timezone(timezone_str)

print(f"Location: {requested_location.address}")
Location: Sioux Falls, Sioux Falls Township, Minnehaha County, South Dakota, United States
# Retrieve station data to perform the lat/lon query
url = "https://data.source.coop/dynamical/asos-parquet/year=2026/data.parquet"
stations_df = duckdb.execute("""
    SELECT DISTINCT station as stid, name as sname, latitude as lat, longitude as lon
    FROM read_parquet($1)
    WHERE longitude IS NOT NULL AND latitude IS NOT NULL
""", [url]).fetchdf()

# Determine which ASOS station is closest to the requested point
user_coords = (requested_location.latitude, requested_location.longitude)
stations_df['distance_miles'] = stations_df.apply(
    lambda row: geodesic(user_coords, (row['lat'], row['lon'])).miles, axis=1
)
nearby_stations = stations_df[stations_df['distance_miles'] <= 20].sort_values('distance_miles')
nearest_station = nearby_stations.iloc[0]

# Print the results of the query
print(f"Nearest station: {nearest_station.stid}, {nearest_station.sname}")
print(f"Distance: {nearest_station['distance_miles']:.1f} miles")Nearest station: FSD, SIOUX FALLS
Distance: 2.4 miles
# Load all data from the nearest station
base = "https://data.source.coop/dynamical/asos-parquet"
urls = [f"{base}/year={y}/data.parquet" for y in range(1940, datetime.now().year + 1)]

location_df = duckdb.execute("""
    SELECT valid as datetime, station, name, longitude, latitude, tmpf as temp_f,
    dwpf as dewpoint_f, relh as relative_humidity, drct as wind_dir, sknt as wspd_kt,
    gust as gust_kt, mslp as msl_pressure, vsby as visibility, p01i as precip_inches
    FROM read_parquet($1, hive_partitioning=true)
    WHERE station = $2
    ORDER BY valid
""", [urls, nearest_station.stid]).fetchdf()

location_df.head()/tmp/ipykernel_4823/3502633930.py:12: Pandas4Warning: The inplace keyword in DataFrame.drop is deprecated and will be removed in a future version (PDEP-8).
See https://pandas.pydata.org/docs/dev/whatsnew/v3.1.0.html#deprecation-inplace for more details.
""", [urls, nearest_station.stid]).fetchdf()
📊 Climatological analysis
The analysis component of the notebook uses the available historical ASOS observations to tell a story about meteorological-informed patterns: daily, and hourly, and historical trends in temperature, dewpoint, visibility, precipitaiton, wind speed, and pressure.
# Convert the UTC time to local time
location_df['datetime'] = location_df['datetime'].dt.round('h').dt.tz_convert(local_tz).dt.tz_localize(None)

# Add metadata to the columns of the dataframe
location_df['date'] = location_df['datetime'].dt.date
location_df['year'] = location_df['datetime'].dt.year
location_df['doy'] = location_df['datetime'].dt.dayofyear
location_df['hour'] = location_df['datetime'].dt.hour

# Calculate daily statistics
daily_stats = location_df.groupby('date').agg(
    tmin=('temp_f', 'min'),
    tmax=('temp_f', 'max'),
    vismean=('visibility', 'mean'),
    preciptotal=('precip_inches', 'sum'),
    dewmean=('dewpoint_f', 'mean'),
    wspdmean=('wspd_kt', 'mean'),
    gustmax=('gust_kt', 'max'),
    gustmean=('gust_kt', 'mean'),
    mslpmin=('msl_pressure', 'min'),
    doy=('doy', 'first'),
    year=('year', 'first')
).reset_index()
/tmp/ipykernel_4823/1863010079.py:7: Pandas4Warning: Series.dt.dayofyear is deprecated and will be removed in a future version. Use Series.dt.day_of_year instead.
location_df['doy'] = location_df['datetime'].dt.dayofyear
Annual averages: a typical year in your location.
This first series of plots averages the meteorological variables by day of year. Use this study to estimate what temperatures you might expect to experience during a typical July, or discover when your chosen location historically experiences the highest winds.
fig, axes = plt.subplots(2, 3, figsize=(22, 15))
axes = axes.flatten()

daily_panels = {
    'Daily Temperature': (['tmax', 'tmin'],['tomato', 'steelblue'],'°F'),
    'Dewpoint':          (['dewmean'], ['teal'],'°F'),
    'Wind Speed':        (['wspdmean'], ['steelblue'],'kt'),
    'Wind Gust':         (['gustmean'], ['slategray'],'kt'),
    'Precipitation':     (['preciptotal'], ['royalblue'],'in'),
    'Visibility':        (['vismean'],['seagreen'],'mi')
}

month_starts = [1, 32, 60, 91, 121, 152, 182, 213, 244, 274, 305, 335]
month_names  = ['Jan','Feb','Mar','Apr','May','Jun','Jul','Aug','Sep','Oct','Nov','Dec']

for ax, (title, (cols, colors, unit)) in zip(axes, daily_panels.items()):
    for col, color in zip(cols, colors):
        doy_avg = daily_stats.groupby('doy')[col].mean()
        smoothed = doy_avg.rolling(15).mean()
        ax.plot(smoothed.index, smoothed.values, color=color, linewidth=1.5)
        ax.fill_between(smoothed.index, smoothed.values, smoothed.min() - 1, alpha=0.5, color=color)

    ax.set_xticks(month_starts)
    ax.set_xticklabels(month_names, fontsize=8)
    ax.set_xlim(1, 365)
    ax.set_ylabel(unit, fontsize=8)
    ax.set_title(title, fontsize=12, fontweight='bold')
    ax.spines['top'].set_visible(False)
    ax.spines['right'].set_visible(False)
    ax.grid(axis='y', linestyle='--', alpha=0.4)
    if title == 'Precipitation':
        ax.set_ylim(bottom=0)

fig.suptitle(f'Annual Climate Averages — {nearest_station.sname}', fontsize=20, fontweight='bold', y=1.01)
plt.tight_layout()
plt.show()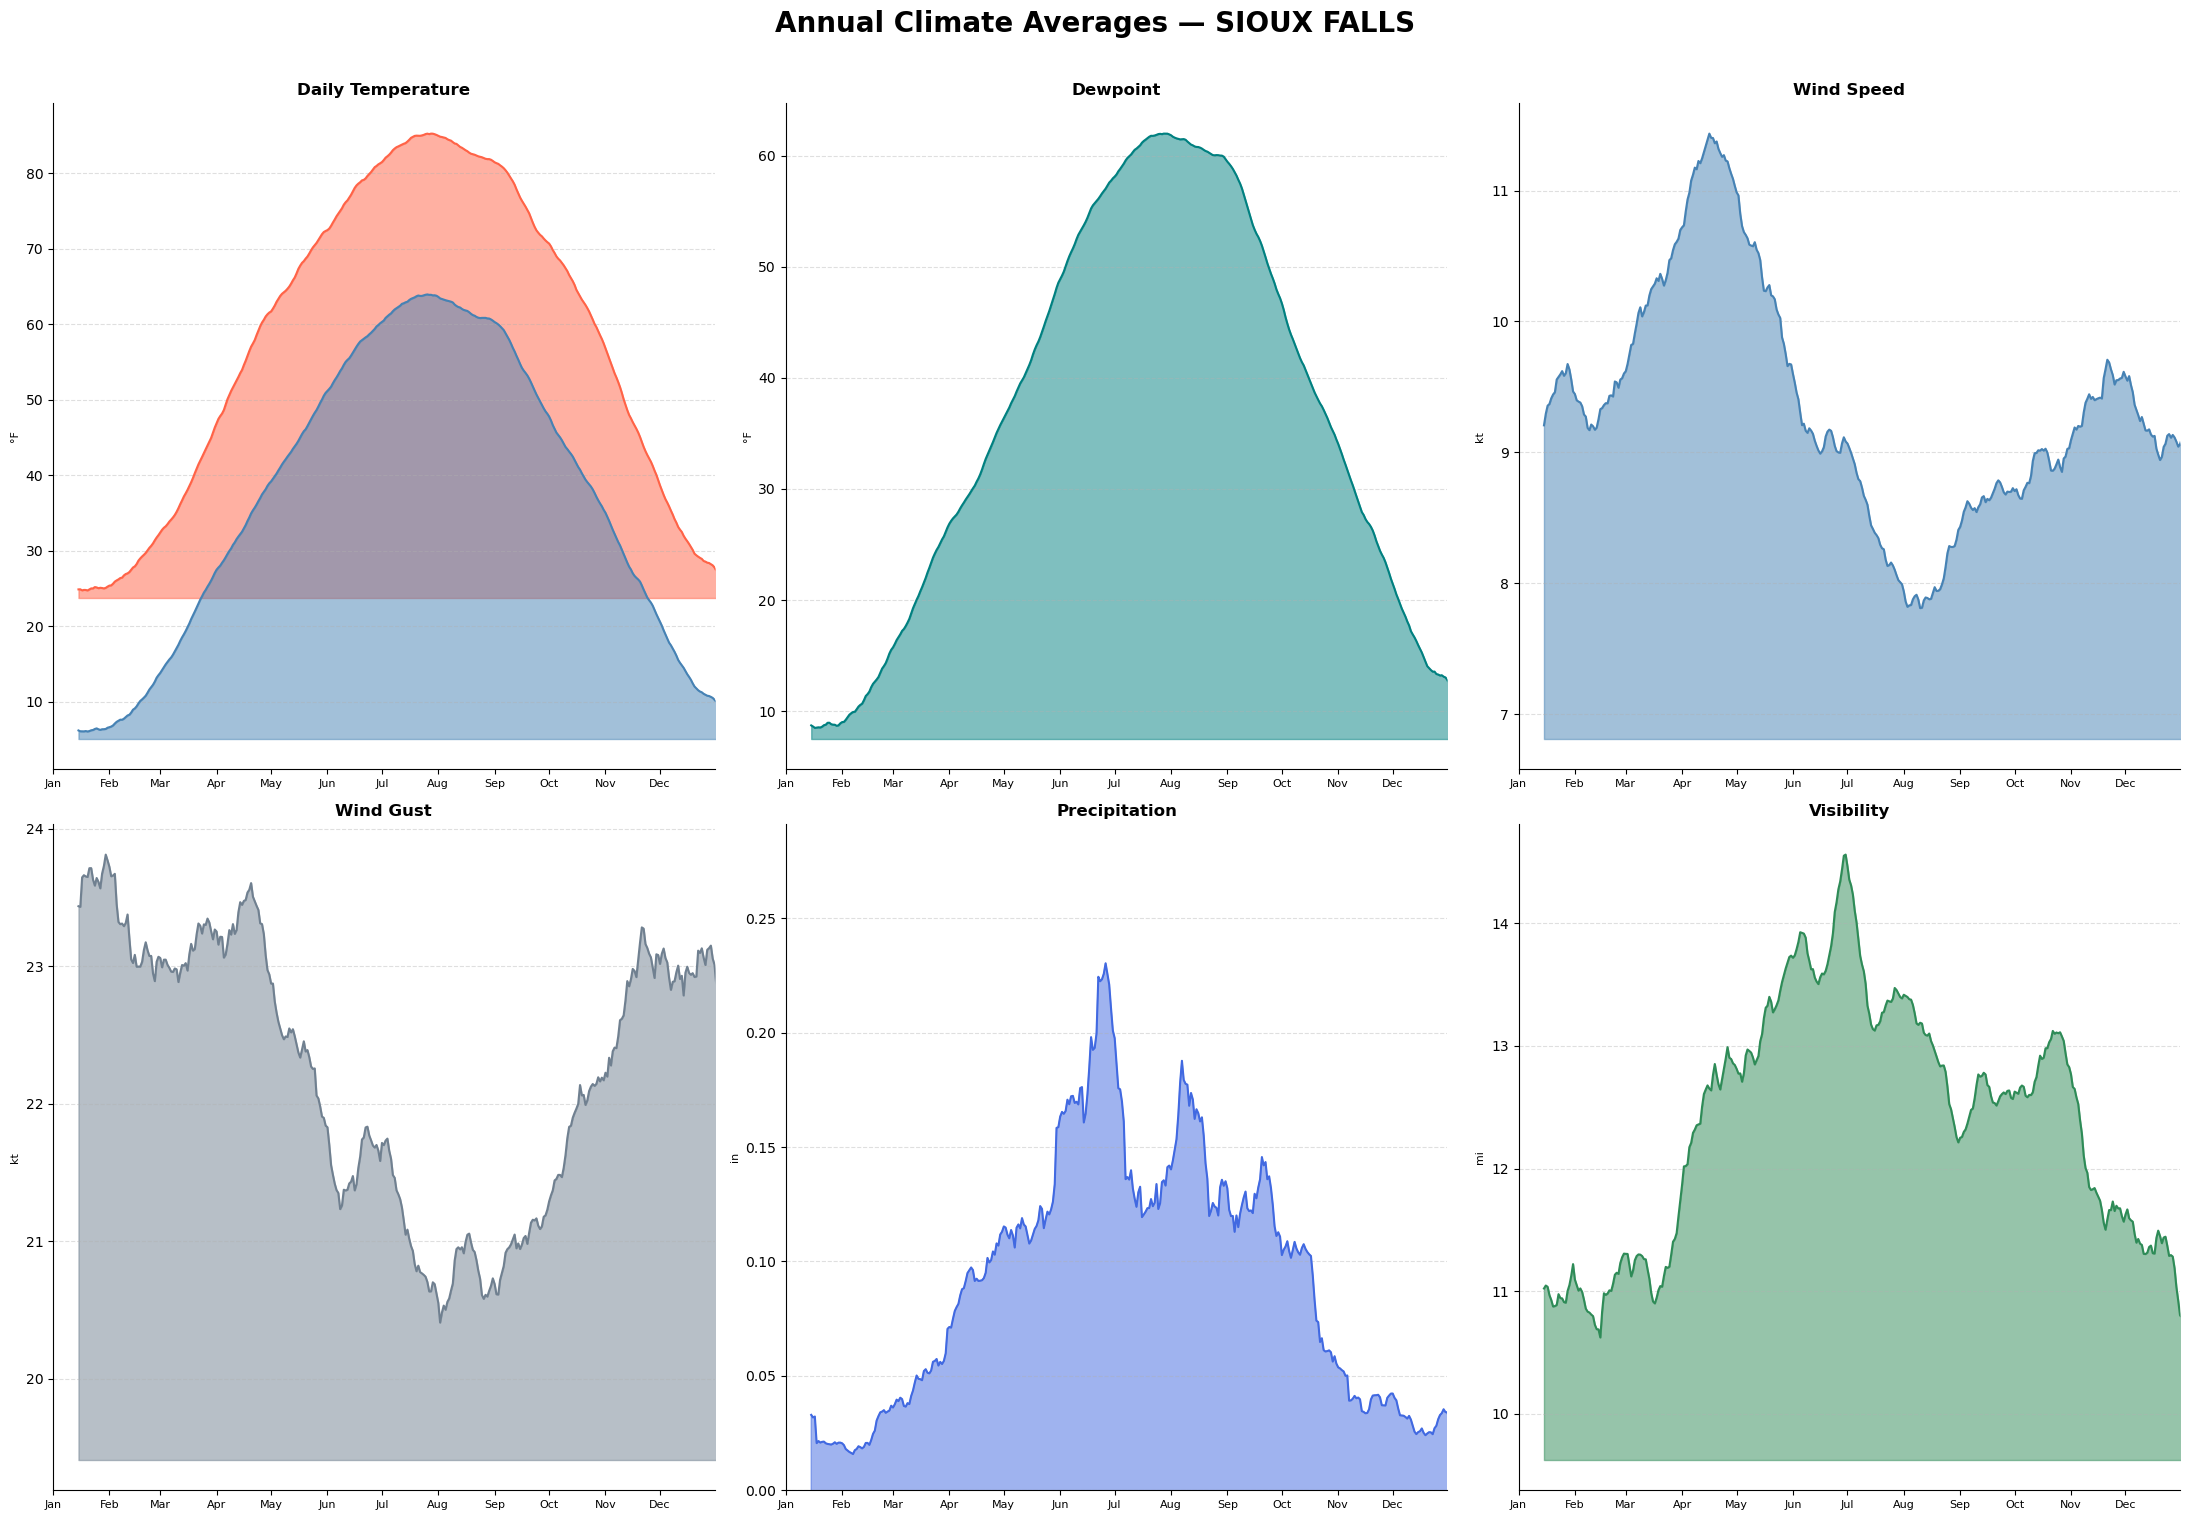
The diurnal cycle: measurements of an average day
This section demonstrates the diurnal cycle, or the average conditions by time of day. Use this study to visualize the time of day that experiences the coldest temperatures, or the hour that has historically received the most precipitaiton.
fig, axes = plt.subplots(2, 3, figsize=(22, 15))
axes = axes.flatten()

hourly_panels = {
    'Daily Temperature': (['temp_f'],        ['tomato'],    '°F'),
    'Dewpoint':          (['dewpoint_f'],     ['teal'],      '°F'),
    'Wind Speed':        (['wspd_kt'],        ['steelblue'], 'kt'),
    'Wind Gust':         (['gust_kt'],        ['slategray'], 'kt'),
    'Precipitation':     (['precip_inches'],  ['royalblue'], 'in'),
    'Visibility':        (['visibility'],     ['seagreen'],  'mi'),
}

for ax, (title, (cols, colors, unit)) in zip(axes, hourly_panels.items()):
    for col, color in zip(cols, colors):
        hourly_avg = location_df.groupby('hour')[col].mean()
        ax.plot(hourly_avg.index, hourly_avg.values, color=color, linewidth=1.5)
        ax.fill_between(hourly_avg.index, hourly_avg.values, hourly_avg.min() - 0.1, alpha=0.5, color=color)

        # Mark peak hour
        peak_hour = hourly_avg.idxmax()
        ax.plot(peak_hour, hourly_avg[peak_hour], 'o', color=color, markersize=5, zorder=5)
        ax.text(peak_hour, hourly_avg[peak_hour] + (hourly_avg.max() - hourly_avg.min()) * 0.02,
                f'{peak_hour:02d}:00', ha='center', fontsize=12, color=color)

    ax.set_xticks(range(0, 24, 3))
    ax.set_xticklabels([f'{h:02d}:00' for h in range(0, 24, 3)], fontsize=8, rotation=45)
    ax.set_xlim(0, 23)
    ax.set_ylabel(unit, fontsize=8)
    ax.set_title(title, fontsize=12, fontweight='bold')
    ax.spines['top'].set_visible(False)
    ax.spines['right'].set_visible(False)
    ax.grid(axis='y', linestyle='--', alpha=0.4)
    if title == 'Precipitation':
        ax.set_ylim(bottom=0)

fig.suptitle(f'Average Diurnal Cycle — {nearest_station.sname}', fontsize=20, fontweight='bold', y=1.01)
plt.tight_layout()
plt.show()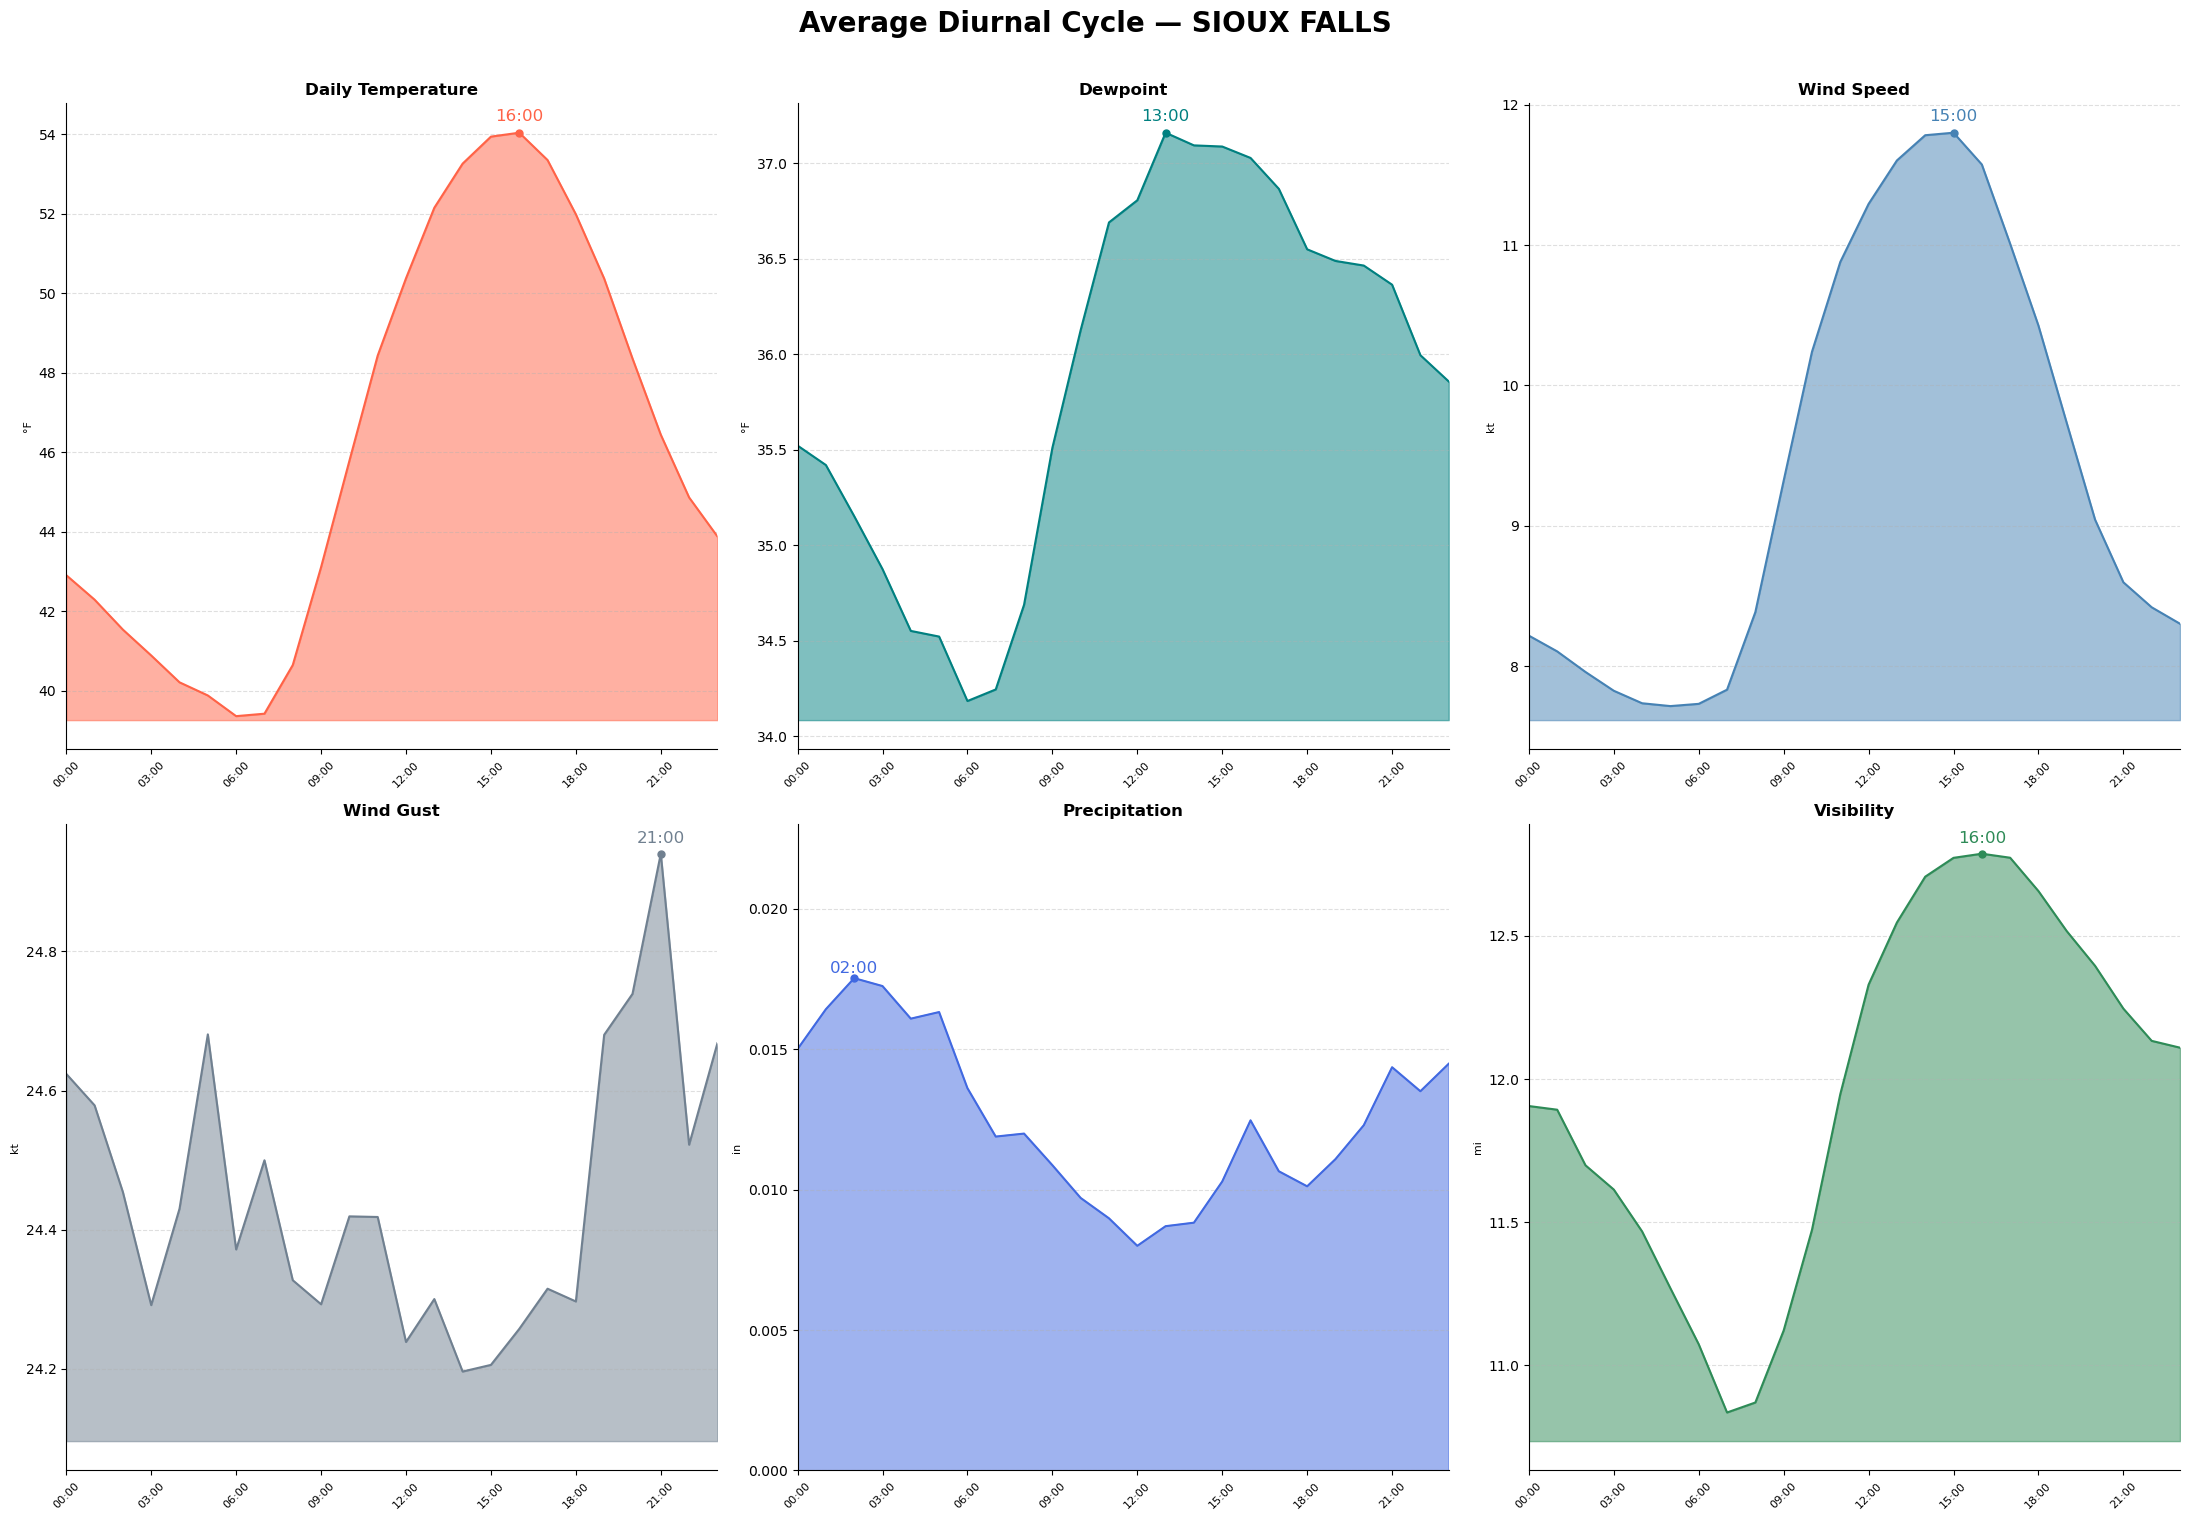
Weather records: a look at the most extreme variables on record
Finally, this study breaks down the 10 most extreme cases of different meteorological conditions. This leaderboard is a look-back at historical events, such as the location’s largest recorded precipitation event, or the most notable heat wave.
fig, axes = plt.subplots(2, 3, figsize=(22, 15))
axes = axes.flatten()

leaderboards = {
    'Hottest Temperature':    ('tmax',         'tomato',    '°F', False),
    'Coldest Temperature':    ('tmin',         'steelblue', '°F', True),
    'Strongest Wind Gust':    ('gustmax',      'slategray', 'kt', False),
    'Highest Dewpoint':       ('dewmean',      'teal',      '°F', False),
    'Greatest Precipitation': ('preciptotal',  'royalblue', 'in', False),
    'Lowest Pressure':        ('mslpmin',      'mediumpurple', 'mb', True),
}

for ax, (title, (col, color, unit, ascending)) in zip(axes, leaderboards.items()):
    top = (
        daily_stats[['date', 'year', col]]
        .dropna(subset=[col])
        .sort_values(col, ascending=ascending)
        .head(10)
        .reset_index(drop=True)
    )
    top.index += 1

    bars = ax.barh(range(len(top)), top[col], color=color, height=0.6)

    for i, row in top.iterrows():
        ref_val = top[col].min() if col == "tmin" else top[col].max()
        ax.text(ref_val/80, i - 1, f"#{i}", ha='left', va='center',
                fontsize=9, color='white', fontweight='bold')

        ax.text(ref_val + ref_val * 0.02, i - 1,
                f"{row[col]:.1f}{unit}  {pd.Timestamp(row['date']).strftime('%b %d, %Y')}",
                va='center', fontsize=9, color=color)
        ax.set_xlim(0, ref_val * 1.5)

    ax.set_yticks([])
    ax.set_title(title, fontsize=12, fontweight='bold')
    ax.spines['top'].set_visible(False)
    ax.spines['right'].set_visible(False)
    ax.tick_params(axis='x', labelsize=7)
    ax.invert_yaxis()

fig.suptitle(f'Daily Weather Records — {nearest_station.sname}', fontsize=20, fontweight='bold', y=1.01)
plt.tight_layout()
plt.show()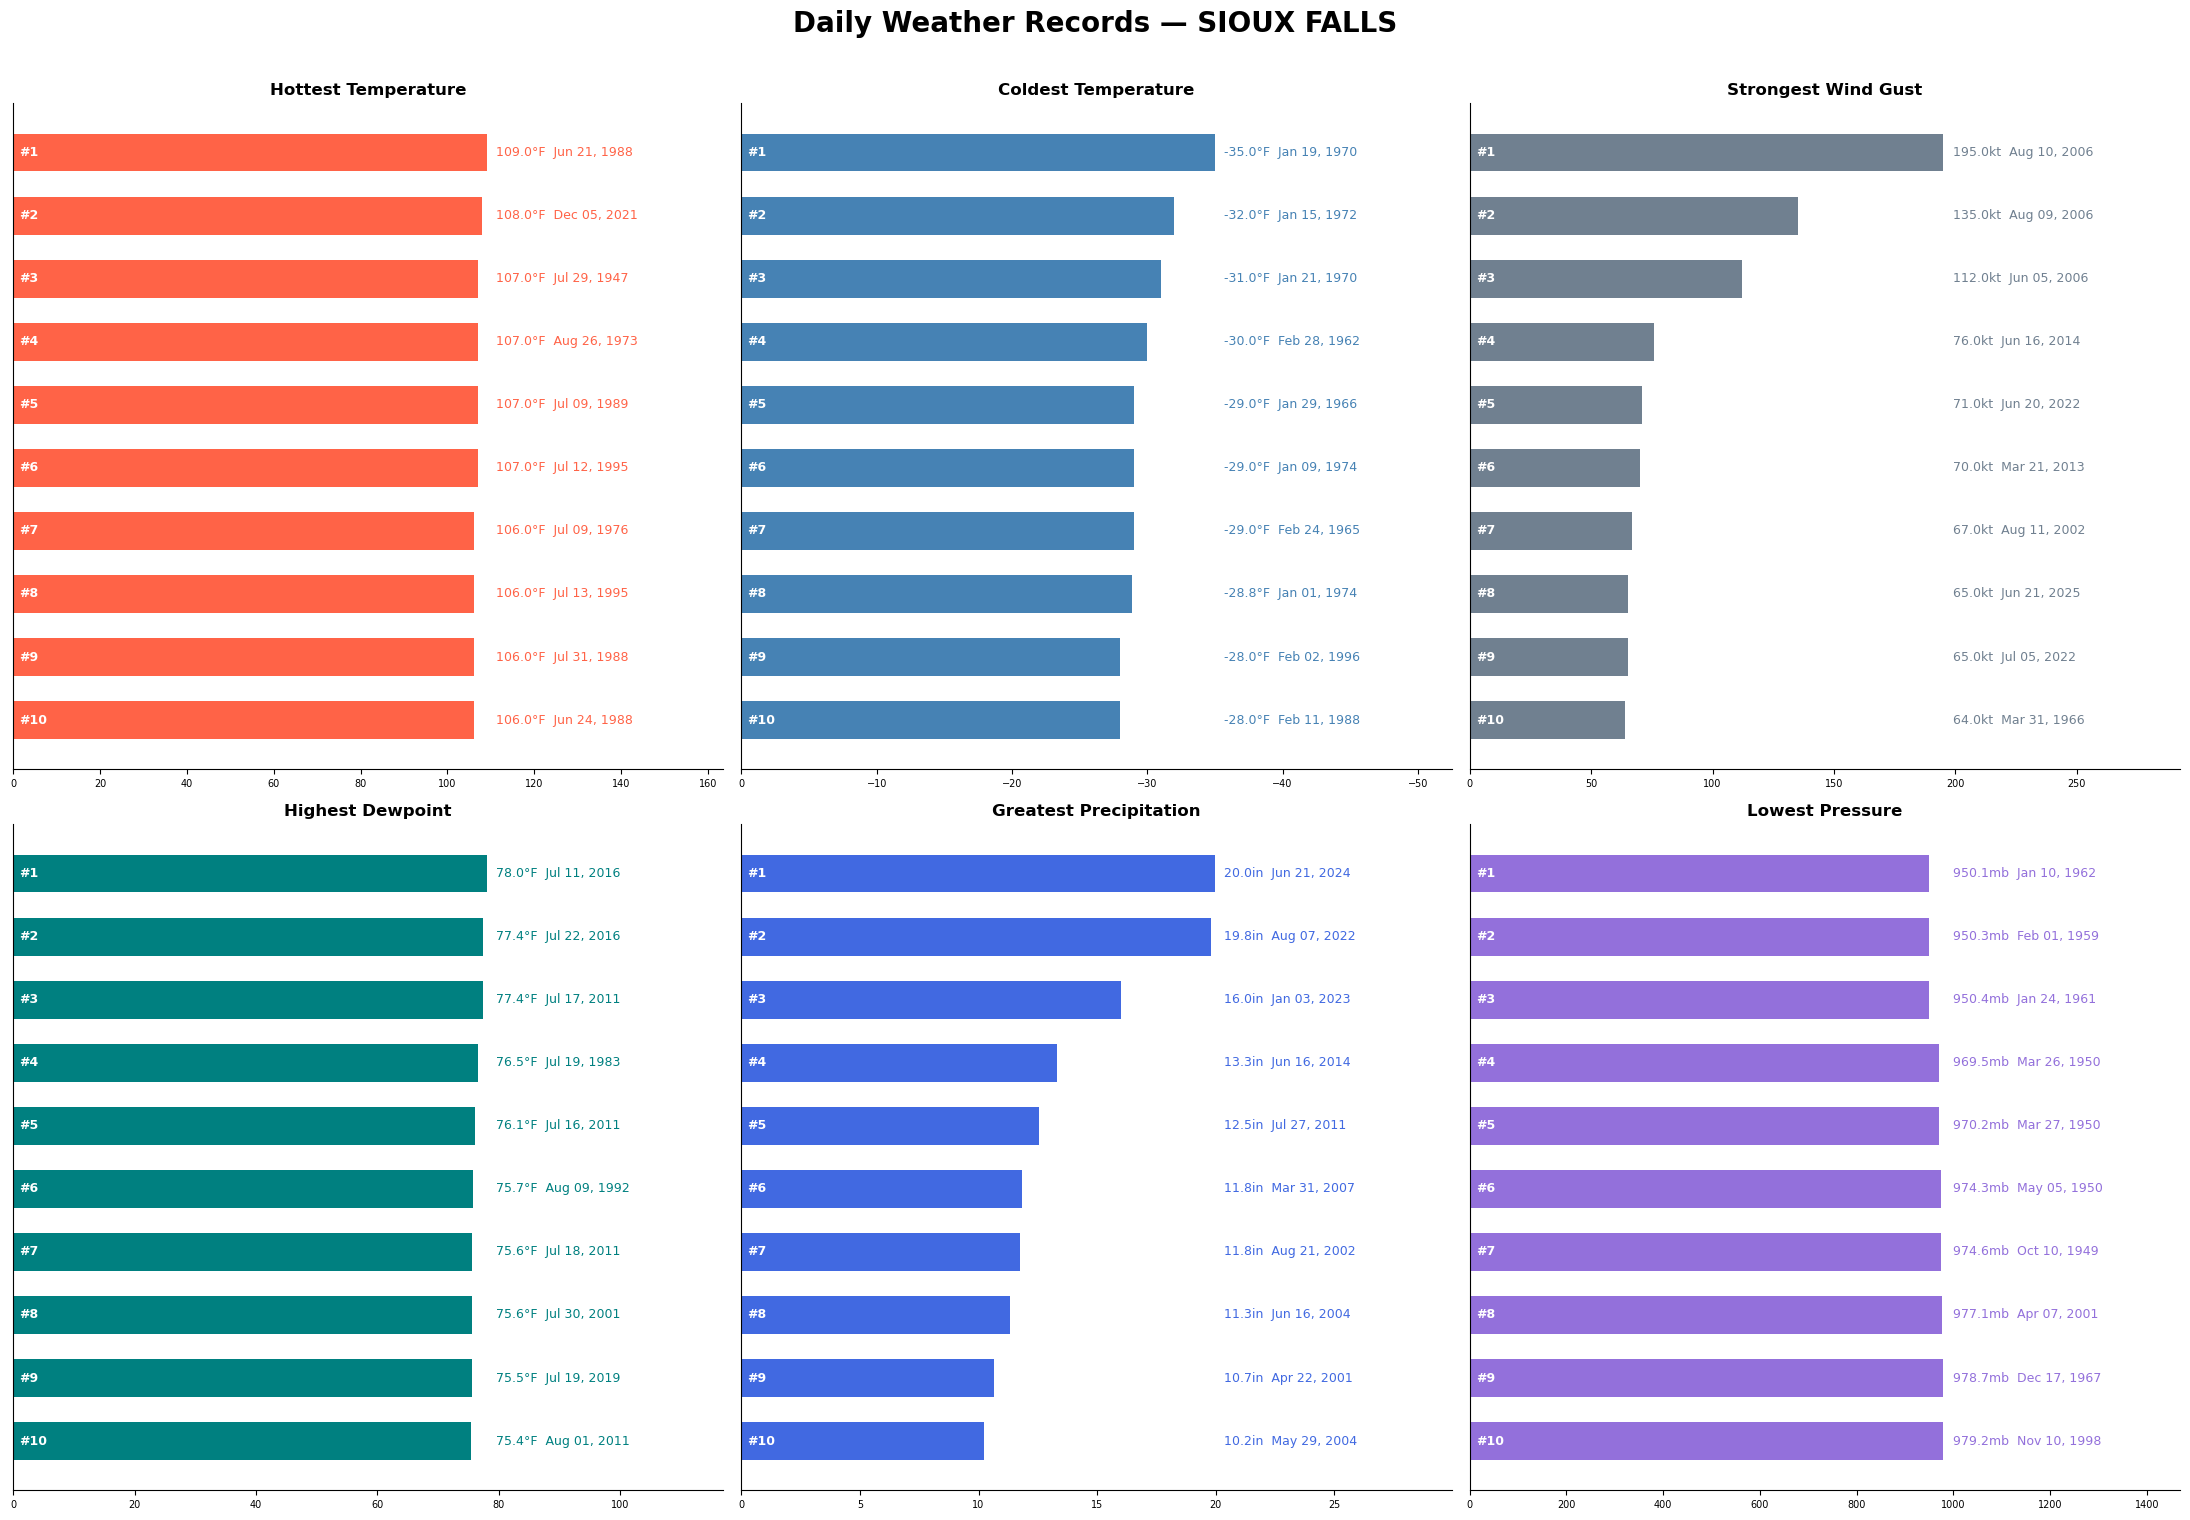
🏆 Bonus Challenges:
You’ve completed the Local Statistics notebook! Congratulations on making a location query, loading METAR data from dynamical.org, and evaluating the resulting plots. If you’d like to continue your learning in this subject area, below are two additional challenges to take your analysis a step further.
🟢 Challenge (easy) -- plot all annual precipitation totals
# Write your code here
🟡 Challenge (medium) -- plot the growing season of each year
# Write your code here
Solution: Click to reveal only AFTER you have tried your own code!
last_spring_freeze = (
    daily_stats[(daily_stats['doy'] < 183) & (daily_stats['tmin'] < 32)]
    .groupby('year')['doy']
    .max()
    .rename('last_spring_freeze'))
first_fall_freeze = (
    daily_stats[(daily_stats['doy'] > 183) & (daily_stats['tmin'] < 32)]
    .groupby('year')['doy']
    .min()
    .rename('first_fall_freeze'))
freeze_indices = (pd.concat([last_spring_freeze, first_fall_freeze], axis=1)).dropna()

def doy_to_ref_date_jan(year, doy):
    real_date = date(int(year), 1, 1) + pd.Timedelta(days=int(doy) - 1)
    return date(2016, real_date.month, real_date.day)

freeze_indices['fall_ref_jan']   = [doy_to_ref_date_jan(y, d) for y, d in
                                    zip(freeze_indices.index, freeze_indices['first_fall_freeze'])
                                   ]
freeze_indices['spring_ref_jan'] = [doy_to_ref_date_jan(y, d) for y, d in
                                    zip(freeze_indices.index, freeze_indices['last_spring_freeze'])
                                   ]

fig, ax = plt.subplots(figsize=(12, 8))
years = freeze_indices.index.tolist()

for year in years:
    row = freeze_indices.loc[year]
    ax.plot(
        [row['spring_ref_jan'], row['fall_ref_jan']], [year, year],
        color='green', linewidth=4, alpha=1)
    ax.text(row['spring_ref_jan'] - pd.Timedelta(days=2), year,
            pd.Timestamp(row['spring_ref_jan']).strftime('%b %d'),
            ha='right', va='center', fontsize=5, color='black')
    ax.text(row['fall_ref_jan'] + pd.Timedelta(days=2), year,
            pd.Timestamp(row['fall_ref_jan']).strftime('%b %d'),
            ha='left', va='center', fontsize=5, color='black')

ax.set_xlim(
    freeze_indices['spring_ref_jan'].min() - pd.Timedelta(days=10),
    freeze_indices['fall_ref_jan'].max() + pd.Timedelta(days=10)
)
ax.xaxis.set_major_locator(mdates.MonthLocator())
ax.xaxis.set_major_formatter(mdates.DateFormatter('%b'))
ax.set_ylim(max(years) + 1, min(years) - 1)
ax.yaxis.set_major_locator(plt.MultipleLocator(10))
ax.set_ylabel('Year')
ax.set_title(f'Growing Season in {nearest_station.sname}: Last Spring Freeze to First Fall Freeze')
ax.grid(axis='x', linestyle='--', alpha=0.4)
plt.tight_layout()
What’s Next?
We will compare METAR observations to a reanalysis.