Objective
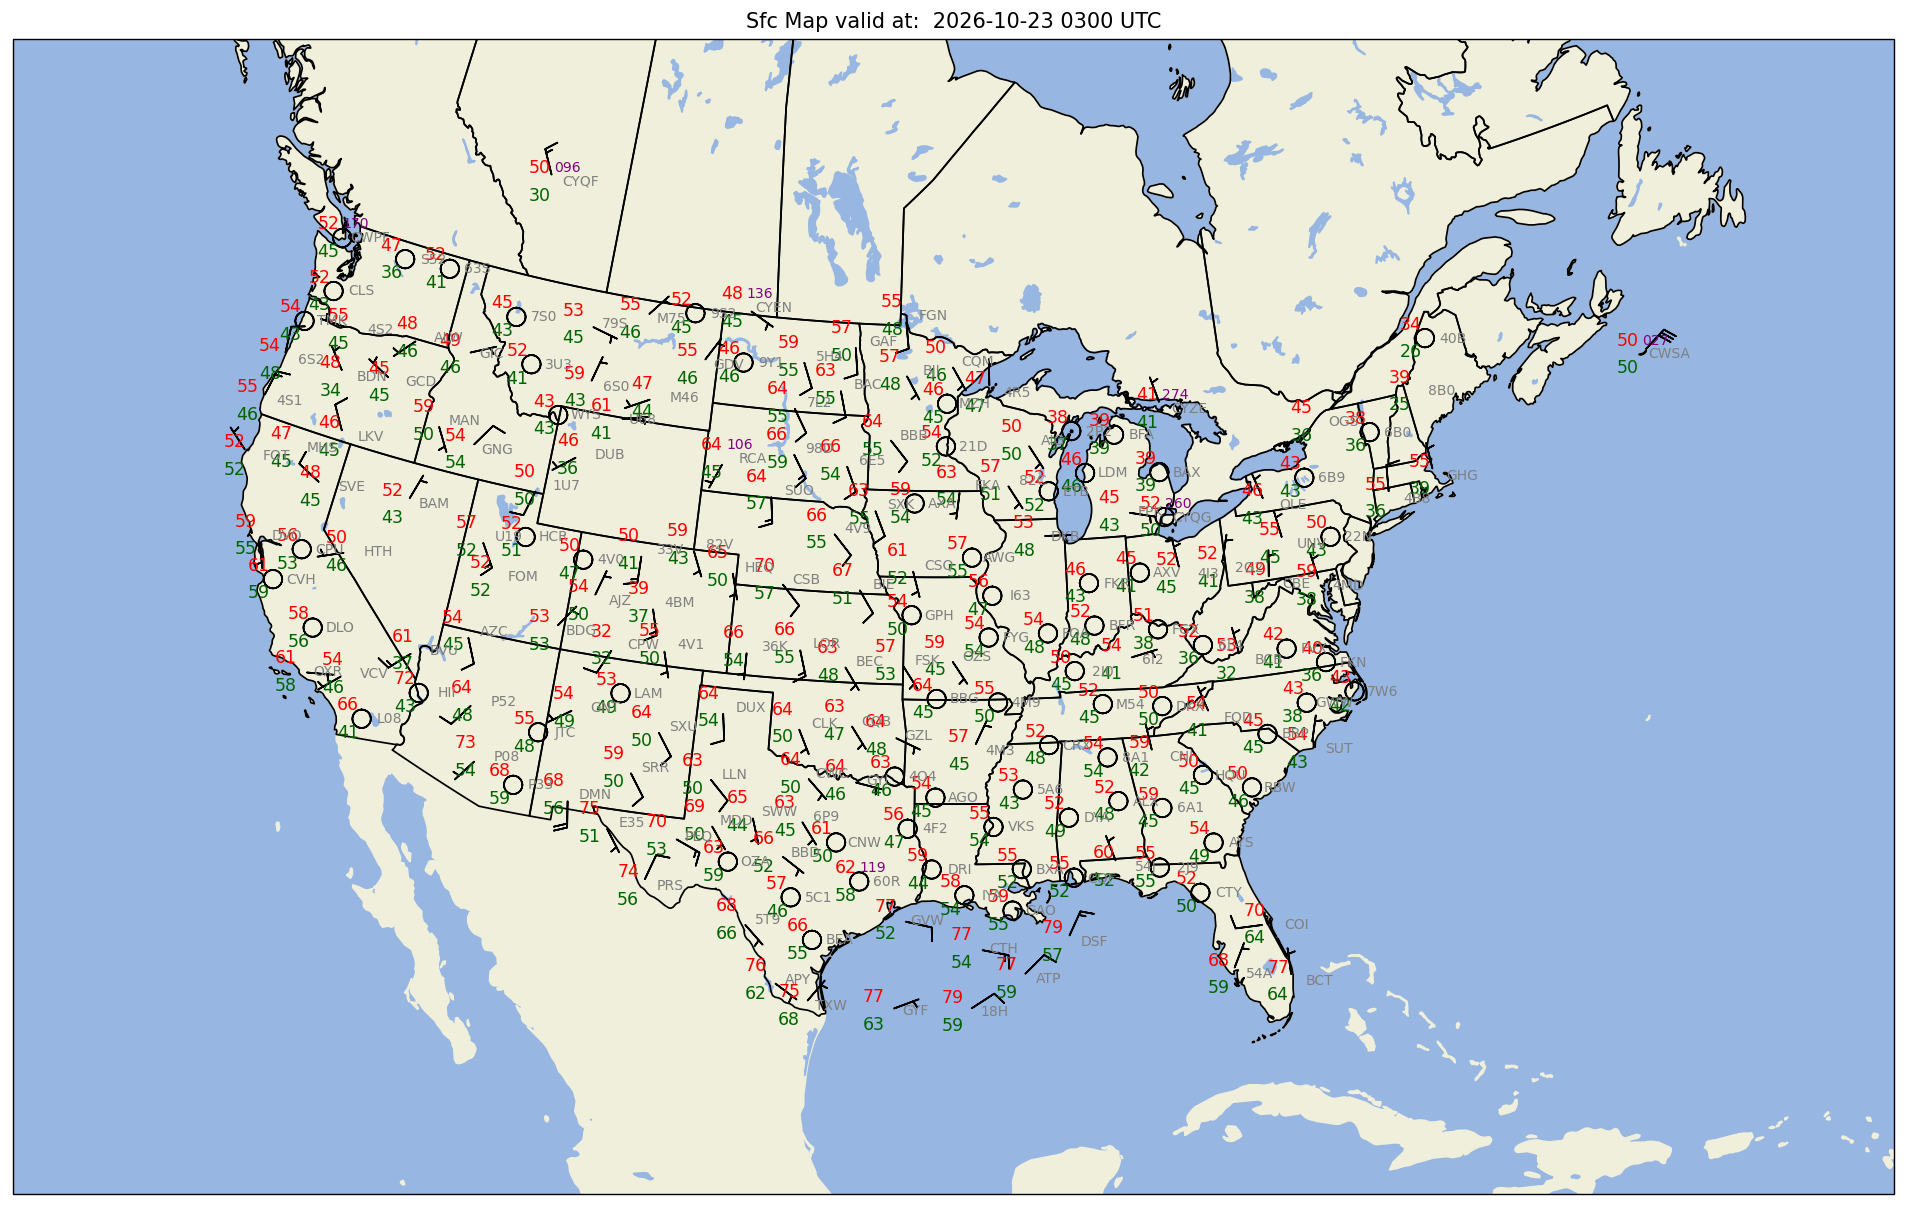
In this notebook, we will make a surface map based on current observations from METAR sites across North America.
from datetime import datetime,timedelta
import numpy as np
import pandas as pd
import matplotlib.pyplot as plt
import matplotlib.text as mtext
import duckdb

import cartopy.crs as ccrs
import cartopy.feature as cfeature

from metpy.calc import wind_components, reduce_point_density
from metpy.units import units
from metpy.plots import StationPlot
from metpy.plots.wx_symbols import current_weather, sky_cover, wx_code_map
Set the domain to gather data from and for defining the plot region.
latN = 55
latS = 20
lonW = -125
lonE = -60

cLat = (latN + latS) / 2
cLon = (lonW + lonE) / 2
# Use the current time, or set your own for a past time.
# Set current to False if you want to specify a past time.
nowTime = datetime.now()
current = True
#current = False
if (current):
time_1 = datetime.now()
offset = timedelta(hours = 1) # Worldwide METARS typically don't come in until ~15 minutes past the hour
time_1 = time_1 - offset
else:
year = 2026
month = 6
day = 18
hour = 18
time_1 = datetime(year, month, day, hour)The timestamps of many hourly METAR reports are 5-10 minutes prior to the top of the hour, though there are also intra-hourly reports, often around 15-20 and 35-40 minutes past the hour. When we make our DuckDB query, we will specify a beginning and end time, 15 minutes apart.
time_0 = time_1 - timedelta(minutes=15)
YYYY_0 = time_0.strftime("%Y")
YYYY_1 = time_1.strftime("%Y")
date_string = time_1.strftime("%Y-%m-%d %H00 UTC")
print(time_0, time_1)
# Handle edge case when the two hours straddle the end/beginning of a yearw
if (YYYY_0 == YYYY_1):
    URLs = [f'https://data.source.coop/dynamical/asos-parquet/year={YYYY_1}/data.parquet']
else:
    URLs = [f'https://data.source.coop/dynamical/asos-parquet/year={YYYY_0}/data.parquet',
            f'https://data.source.coop/dynamical/asos-parquet/year={YYYY_1}/data.parquet']
2026-10-23 03:09:24.173685 2026-10-23 03:24:24.173685
Open the GeoParquet file for the specific year.
df = duckdb.execute("""
    SELECT *
    FROM read_parquet($1, hive_partitioning=true)
    WHERE
---      country = 'FR' AND
---    station = 'ENGM' AND
    valid BETWEEN $2 AND $3
    ORDER BY country
""", [URLs, time_0, time_1]).fetchdf()/tmp/ipykernel_4488/3583836804.py:9: Pandas4Warning: The inplace keyword in DataFrame.drop is deprecated and will be removed in a future version (PDEP-8).
See https://pandas.pydata.org/docs/dev/whatsnew/v3.1.0.html#deprecation-inplace for more details.
""", [URLs, time_0, time_1]).fetchdf()
Perform the spatial subset. Extend the data bounds slightly.
extend = 1
df2 = df.query('latitude >= (@latS - @extend) & latitude <= (@latN + @extend) & longitude >= (@lonW - @extend) & longitude <= (@lonE + @extend)')df2Select the weather variables of interest. Also include the site ID, lat, lon, elevation, and time columns.
df2.columnsIndex(['station', 'valid', 'longitude', 'latitude', 'tmpf', 'tmpc', 'dwpf',
'dwpc', 'relh', 'drct', 'sknt', 'gust', 'alti', 'mslp', 'vsby', 'p01i',
'p01m', 'state', 'geometry', 'name', 'elevation', 'country', 'county',
'wfo', 'tzname', 'bbox', 'year'],
dtype='str')columnSubset = ['station', 'valid', 'latitude', 'longitude', 'elevation', 'tmpc', 'dwpc', 'mslp',
'sknt', 'drct','alti','vsby','p01i']data = df2[columnSubset]dataRead in several of the columns as Pandas Series; extract the value arrays from the Series objects; assign / convert units as necessary
lats = data['latitude'].values
lons = data['longitude'].values
tair = (data['tmpc'].values * units ('degC')).to('degF')
dewp = (data['dwpc'].values * units ('degC')).to('degF')
altm = (data['alti'].values * units('inHg')).to('mbar')
slp = data['mslp'].values * units('hPa')

# Convert wind to components
u, v = wind_components(data['sknt'].values * units.knots, data['drct'].values * units.degree)

stid = data['station']
The next step deals with the removal of overlapping stations, using reduce_point_density. This returns a mask we can apply to data to filter the points.
Select a Cartopy map projection, which we will use both to reduce plotted station density and to plot the data on a map.
# Uncomment whichever projection you want (or add your own!)
#proj = ccrs.Stereographic(central_longitude=cLon, central_latitude=cLat)
proj_map = ccrs.LambertConformal(central_longitude=cLon, central_latitude=cLat)
proj_data = ccrs.PlateCarree()
spacing = 150000 # meters; change depending on the map area
xy = proj_map.transform_points(proj_data, lons, lats)
mask = reduce_point_density(xy, spacing)Visualize Surface Observations
Simple station plotting using plot methods
One way to create station plots with MetPy is to create an instance of StationPlot and call various plot methods, like plot_parameter, to plot arrays of data at locations relative to the center point.
In addition to plotting values, StationPlot has support for plotting text strings, symbols, and plotting values using custom formatting.
Now we just plot with arr[mask] for every arr of data we use in plotting.
# Set up a plot with map features
# First set dpi ("dots per inch") - higher values will give us a less pixelated final figure.
dpi = 125

fig = plt.figure(figsize=(20,12), dpi=dpi)

ax = fig.add_subplot(1, 1, 1, projection=proj_map) # We use the projection defined above
ax.set_facecolor(cfeature.COLORS['water'])

land_mask = cfeature.NaturalEarthFeature('physical', 'land', '50m',
                                        edgecolor='face',
                                        facecolor=cfeature.COLORS['land'])
lake_mask = cfeature.NaturalEarthFeature('physical', 'lakes', '50m',
                                        edgecolor='face',
                                        facecolor=cfeature.COLORS['water'])
state_borders = cfeature.NaturalEarthFeature(category='cultural', name='admin_1_states_provinces_lakes',
                                         scale='50m', facecolor='none')

ax.add_feature(land_mask)
ax.add_feature(lake_mask)
ax.add_feature(state_borders, linestyle='solid', edgecolor='black')

ax.set_extent ((lonW, lonE, latS, latN), crs=proj_data)

#If we wanted to add grid lines to our plot:
#ax.gridlines()

# Create a station plot pointing to an Axes to draw on as well as the location of points
stationplot = StationPlot(ax, lons[mask], lats[mask], transform=ccrs.PlateCarree(),
                          fontsize=8)

stationplot.plot_parameter('NW', tair[mask], color='red', fontsize=10)
stationplot.plot_parameter('SW', dewp[mask], color='darkgreen', fontsize=10)

# Below, we are using a custom formatter to control how the sea-level pressure
# values are plotted. This uses the standard trailing 3-digits of the pressure value
# in tenths of millibars.
stationplot.plot_parameter('NE', slp[mask], color='purple', formatter=lambda v: format(10 * v, '.0f')[-3:])


#stationplot.plot_symbol('C', cloud_cover[mask], sky_cover)
#stationplot.plot_symbol('W', wnum[mask], current_weather,color='blue',fontsize=12)
stationplot.plot_text((2, 0),stid[mask], color='gray')
#zorder - Higher value zorder will plot the variable on top of lower value zorder. This is necessary for wind barbs to appear. Default is 1.
stationplot.plot_barb(u[mask], v[mask],zorder=2)

# Remove any text that appears outside the borders of the Axes

for obj in ax.findobj(mtext.Text):
    obj.set_clip_on(True)
plotTitle = (f"Sfc Map valid at:  {date_string}")
ax.set_title (plotTitle);
/home/runner/micromamba/envs/METAR_archive-cookbook/lib/python3.14/site-packages/cartopy/io/__init__.py:263: DownloadWarning: Downloading: https://naturalearth.s3.amazonaws.com/50m_physical/ne_50m_land.zip
warnings.warn(f'Downloading: {url}', DownloadWarning)
/home/runner/micromamba/envs/METAR_archive-cookbook/lib/python3.14/site-packages/cartopy/io/__init__.py:263: DownloadWarning: Downloading: https://naturalearth.s3.amazonaws.com/50m_physical/ne_50m_lakes.zip
  warnings.warn(f'Downloading: {url}', DownloadWarning)
/home/runner/micromamba/envs/METAR_archive-cookbook/lib/python3.14/site-packages/cartopy/io/__init__.py:263: DownloadWarning: Downloading: https://naturalearth.s3.amazonaws.com/50m_cultural/ne_50m_admin_1_states_provinces_lakes.zip
  warnings.warn(f'Downloading: {url}', DownloadWarning)
Summary
You now know how to create surface maps from a constantly-updating archive of worldwide METAR observations.
Future work
Add support for alternative METAR data sources
Plot cloud cover and present weather symbols
What’s Next?
We will create an interactive visualization of METAR data, using GeoPandas.