This notebook allows for easy access to snow depths and SWE from the Snow Telemetry (SNOTEL) network. A simple example is used to show quick access to SNOTEL data over Creamer’s Field, AK using the metloom package.
Credit: M3Works for the metloom package, which can be found here: https://
from datetime import datetime
import pandas as pd
import geopandas as gpd
from pathlib import Path
import matplotlib.pyplot as plt
import os
Metloom allows for easy access to several weather station types, including SNOTEL, MesoWest, and NorwayMet. The primary query function for each is SnotelPointData (replace “Snotel” with station of choice), which also allows us to view the locations of weather stations. We’ll start this example doing just that.
# Import the SNOTEL pointdata classes
from metloom.pointdata import SnotelPointData

# Import the SNOTEL variable classes
from metloom.variables import SnotelVariables
We are going to look for active SNOTEL stations near Creamer’s Field in Fairbanks, AK. The below cells search for SNOTEL stations within 0.5 degrees latitude/longitude of the provided polygon.
We will also go ahead and define the variables we want from the station, using SnotelPointData.ALLOWED_VARIABLES. Some of the allowed variables include:
SNOWDEPTH: Snow depth, typically in inches.SWE: Snow water equivalent, typically in inches.PRECIPITATION: Accumulated precipitation, in inches.TMP: Air temperature, in degrees Fahrenheit.
# Load FLCF lidar box from SnowEx campaigns
sf_path = Path("data/cffl_lidar_box.geojson").expanduser()
sf = gpd.read_file(str(sf_path))
sf["name"] = ["FLCF"]

# Load the desired variables for SNOTEL query
variables = [SnotelPointData.ALLOWED_VARIABLES.SNOWDEPTH]
# Find SNOTEL stations within polygon with desired variables
try:
points = SnotelPointData.points_from_geometry(sf, variables)
# Print nearby SNOTEL stations within 0.5 degrees of polygon
print(SnotelPointData.points_from_geometry(sf, variables, buffer=0.5).points)
except Exception as e:
print(f"Could not connect to SNOTEL API: {e}")
print("Skipping live data fetch — likely running in a restricted network environment (e.g., CI).")[SnotelPointData('1302:AK:SNTL', 'Creamers Field')]
Looks like we have a SNOTEL station here! Note the printed output: Metloom returns the station ID number (1302), the state it’s in (AK), and the type of weather station (SNTL).
Let’s see where it’s located in Creamer’s Field, relative to the polyon we provided.
# Plot lidar box over ESRI tiles and the SNOTEL station location (if available)
if 'points' in dir() and points is not None:
    m = sf.explore(
        tooltip=False, color="grey", highlight=False, tiles="Esri.WorldImagery",
        style_kwds={"opacity": 0.2}, popup=["name"]
    )
    # Add plot showing location of SNOTEL station(s)
    df = points.to_dataframe()
    df.explore(m=m, tooltip=["name", "id"], color="red", marker_kwds={"radius":4})
    display(m)
else:
    print("Skipping map — SNOTEL station data not available (API unreachable).")
Now that we know which SNOTEL is in the area, we can query for the data.
# Define SNOTEL station from FLCF
pt = SnotelPointData("1302:AK:SNTL", "Creamer's Field")
As with other API requests, we can subset the data with a date range, given as datetime objects.
Note here that we are requesting for snow depths on a daily basis. If desired, we could also obtain the hourly data instead, using pt.get_hourly_data().
# Start and end date of SNOTEL query
start_date = datetime(2022, 3, 1)
end_date = datetime(2023, 4, 1)

cached_path = Path("data/snotel_1302_snow_depth.csv")

try:
    df = pt.get_daily_data(start_date, end_date, variables)
except Exception as e:
    print(f"Live fetch failed: {e}")
    if cached_path.exists():
        print("Loading cached data instead.")
        df = pd.read_csv(cached_path, index_col=0, parse_dates=True)
    else:
raise RuntimeError("No cached data available and live fetch failed.") from edf.head()Easy enough! We now have a data frame containing the basic information of the SNOTEL site, as well as the snow depth in inches.
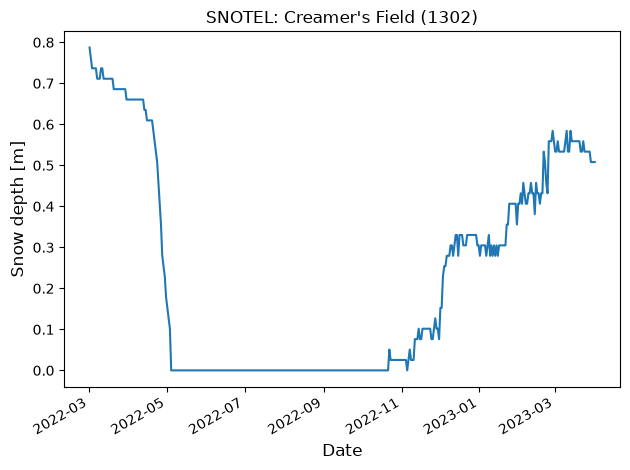
Since inches aren’t very useful in scientific analysis, and SNOWDEPTH can be a hassle to type out, let’s make a new column that shows the depth in meters.
# Convert snow depth to meters
df['snow_depth_meters'] = df['SNOWDEPTH']*0.0254
From there, it’s simple to plot the snow depth data as a time series.
# Plot time series of daily SNOTEL data
fig, ax = plt.subplots()
df.reset_index().set_index("datetime")["snow_depth_meters"].plot(ax=ax)
ax.set_xlabel("Date", fontsize=12)
ax.set_ylabel("Snow depth [m]", fontsize=12)
ax.set_title("SNOTEL: Creamer's Field (1302)", fontsize=12)
fig.tight_layout()