Contributors: Steven Pestana
Download the sample datasets for this tutorial
For ease of access during the hackweek, sample files are available for download for running the command in the cell below.
# S3 base URL for tutorial data
S3_BASE_URL = "https://snowex-tutorials.s3.us-west-2.amazonaws.com/thermal-ir/"
Import the packages we’ll need for this tutorial
# Import some general-purpose packages for handling different data structures
import numpy as np # for working with n-D arrays
import pandas as pd # for reading our csv data file and working with tabular data

# Import matplotlib which we'll use for plotting images and graphs
import matplotlib.pyplot as plt

# Import these packages for working with raster data
import xarray as xr # xarray lets us work with n-D arrays and labeled data, such as NetCDF files
import rioxarray # rioxarray provides capabilities of the rasterio package to xarray, letting us easily work with files such as GeoTIFFs
import fsspec

# Import some packages for working with the SnowEx SQL database
from snowexsql.lambda_client import SnowExLambdaClient
from datetime import datetime # Import some tools to build dates
Part 1: Comparing airborne IR imagery with ground-truth observations
Airborne IR imagery

The Naval Postgraduate School Twin Otter aircraft carried the UW APL thermal infrared imager and SWESARR instrument over Grand Mesa for SnowEx 2020. (Photo by Chris Chickadel)
Load IR image mosaic geotiff file
airborne_ir = rioxarray.open_rasterio(S3_BASE_URL + 'SNOWEX2020_IR_PLANE_2020Feb08_mosaicked_2020-02-08T181915.tif')Warning 1: HTTP response code on https://snowex-tutorials.s3.us-west-2.amazonaws.com/thermal-ir/SNOWEX2020_IR_PLANE_2020Feb08_mosaicked_2020-02-08T181915.hdr: 403
Warning 1: HTTP response code on https://snowex-tutorials.s3.us-west-2.amazonaws.com/thermal-ir/SNOWEX2020_IR_PLANE_2020Feb08_mosaicked_2020-02-08T181915.HDR: 403
Warning 1: HTTP response code on https://snowex-tutorials.s3.us-west-2.amazonaws.com/thermal-ir/SNOWEX2020_IR_PLANE_2020Feb08_mosaicked_2020-02-08T181915.IMD: 403
Warning 1: HTTP response code on https://snowex-tutorials.s3.us-west-2.amazonaws.com/thermal-ir/SNOWEX2020_IR_PLANE_2020Feb08_mosaicked_2020-02-08T181915.imd: 403
Warning 1: HTTP response code on https://snowex-tutorials.s3.us-west-2.amazonaws.com/thermal-ir/SNOWEX2020_IR_PLANE_2020Feb08_mosaicked_2020-02-08T181915.RPB: 403
Warning 1: HTTP response code on https://snowex-tutorials.s3.us-west-2.amazonaws.com/thermal-ir/SNOWEX2020_IR_PLANE_2020Feb08_mosaicked_2020-02-08T181915.rpb: 403
Warning 1: HTTP response code on https://snowex-tutorials.s3.us-west-2.amazonaws.com/thermal-ir/SNOWEX2020_IR_PLANE_2020Feb08_mosaicked_2020-02-08T181915.PVL: 403
Warning 1: HTTP response code on https://snowex-tutorials.s3.us-west-2.amazonaws.com/thermal-ir/SNOWEX2020_IR_PLANE_2020Feb08_mosaicked_2020-02-08T181915.pvl: 403
Warning 1: HTTP response code on https://snowex-tutorials.s3.us-west-2.amazonaws.com/thermal-ir/SNOWEX2020_IR_PLANE_2020Feb08_mosaicked_2020-02-08T181915_rpc.txt: 403
Warning 1: HTTP response code on https://snowex-tutorials.s3.us-west-2.amazonaws.com/thermal-ir/SNOWEX2020_IR_PLANE_2020Feb08_mosaicked_2020-02-08T181915_RPC.TXT: 403
Warning 1: HTTP response code on https://snowex-tutorials.s3.us-west-2.amazonaws.com/thermal-ir/SNOWEX2020_IR_PLANE_2020Feb08_mosaicked_2020-02-08T181915_metadata.txt: 403
Warning 1: HTTP response code on https://snowex-tutorials.s3.us-west-2.amazonaws.com/thermal-ir/SNOWEX2020_IR_PLANE_2020Feb08_mosaicked_2020-02-08T181915_METADATA.txt: 403
Warning 1: HTTP response code on https://snowex-tutorials.s3.us-west-2.amazonaws.com/thermal-ir/SNOWEX2020_IR_PLANE_2020Feb08_mosaicked_2020-02-08T181915_MTL.txt: 403
Warning 1: HTTP response code on https://snowex-tutorials.s3.us-west-2.amazonaws.com/thermal-ir/SNOWEX2020_IR_PLANE_2020Feb08_mosaicked_2020-02-08T181915_MTL.TXT: 403
Warning 1: HTTP response code on https://snowex-tutorials.s3.us-west-2.amazonaws.com/thermal-ir/METADATA.DIM: 403
Warning 1: HTTP response code on https://snowex-tutorials.s3.us-west-2.amazonaws.com/thermal-ir/metadata.dim: 403
Warning 1: HTTP response code on https://snowex-tutorials.s3.us-west-2.amazonaws.com/thermal-ir/SNOWEX2020_IR_PLANE_2020Feb08_mosaicked_2020-02-08T181915_metadata.xml: 403
Warning 1: HTTP response code on https://snowex-tutorials.s3.us-west-2.amazonaws.com/thermal-ir/SNOWEX2020_IR_PLANE_2020Feb08_mosaicked_2020-02-08T181915_METADATA.XML: 403
Warning 1: HTTP response code on https://snowex-tutorials.s3.us-west-2.amazonaws.com/thermal-ir/SNOWEX2020_IR_PLANE_2020Feb08_mosaicked_2020-02-08T181915.TXT: 403
Warning 1: HTTP response code on https://snowex-tutorials.s3.us-west-2.amazonaws.com/thermal-ir/SNOWEX2020_IR_PLANE_2020Feb08_mosaicked_2020-02-08T181915.txt: 403
Warning 1: HTTP response code on https://snowex-tutorials.s3.us-west-2.amazonaws.com/thermal-ir/SNOWEX2020_IR_PLANE_2020Feb08_mosaicked_2020-02-08T181915.RPC: 403
Warning 1: HTTP response code on https://snowex-tutorials.s3.us-west-2.amazonaws.com/thermal-ir/SNOWEX2020_IR_PLANE_2020Feb08_mosaicked_2020-02-08T181915.rpc: 403
Warning 1: HTTP response code on https://snowex-tutorials.s3.us-west-2.amazonaws.com/thermal-ir/summary.txt: 403
Warning 1: HTTP response code on https://snowex-tutorials.s3.us-west-2.amazonaws.com/thermal-ir/SUMMARY.TXT: 403
Warning 1: HTTP response code on https://snowex-tutorials.s3.us-west-2.amazonaws.com/thermal-ir/HDR2020_IR_PLANE_2020Feb08_mosaicked_2020-02-08T181915.txt: 403
Warning 1: HTTP response code on https://snowex-tutorials.s3.us-west-2.amazonaws.com/thermal-ir/HDR2020_IR_PLANE_2020Feb08_mosaicked_2020-02-08T181915.TXT: 403
Warning 1: HTTP response code on https://snowex-tutorials.s3.us-west-2.amazonaws.com/thermal-ir/HDRWEX2020_IR_PLANE_2020Feb08_mosaicked_2020-02-08T181915.txt: 403
Warning 1: HTTP response code on https://snowex-tutorials.s3.us-west-2.amazonaws.com/thermal-ir/HDRWEX2020_IR_PLANE_2020Feb08_mosaicked_2020-02-08T181915.TXT: 403
Warning 1: HTTP response code on https://snowex-tutorials.s3.us-west-2.amazonaws.com/thermal-ir/RPC2020_IR_PLANE_2020Feb08_mosaicked_2020-02-08T181915.txt: 403
Warning 1: HTTP response code on https://snowex-tutorials.s3.us-west-2.amazonaws.com/thermal-ir/RPC2020_IR_PLANE_2020Feb08_mosaicked_2020-02-08T181915.TXT: 403
Warning 1: HTTP response code on https://snowex-tutorials.s3.us-west-2.amazonaws.com/thermal-ir/RPCWEX2020_IR_PLANE_2020Feb08_mosaicked_2020-02-08T181915.txt: 403
Warning 1: HTTP response code on https://snowex-tutorials.s3.us-west-2.amazonaws.com/thermal-ir/RPCWEX2020_IR_PLANE_2020Feb08_mosaicked_2020-02-08T181915.TXT: 403
Inspect the contents of the file we just opened
airborne_irairborne_ir.rio.crs # original CRSCRS.from_wkt('PROJCS["WGS 84 / UTM zone 12N",GEOGCS["WGS 84",DATUM["WGS_1984",SPHEROID["WGS 84",6378137,298.257223563,AUTHORITY["EPSG","7030"]],AUTHORITY["EPSG","6326"]],PRIMEM["Greenwich",0,AUTHORITY["EPSG","8901"]],UNIT["degree",0.0174532925199433,AUTHORITY["EPSG","9122"]],AUTHORITY["EPSG","4326"]],PROJECTION["Transverse_Mercator"],PARAMETER["latitude_of_origin",0],PARAMETER["central_meridian",-111],PARAMETER["scale_factor",0.9996],PARAMETER["false_easting",500000],PARAMETER["false_northing",0],UNIT["metre",1,AUTHORITY["EPSG","9001"]],AXIS["Easting",EAST],AXIS["Northing",NORTH],AUTHORITY["EPSG","32612"]]')Under the dataarray’s attributes we can see that we have a coordinate reference system already defined (crs) as EPSG:32612. We can also find this through da.rio.crs.
However, we would like to reproject this into the common projection used by datasets on the SnowEx SQL database: EPSG:26912. We can do that using rioxarray’s reproject method (see an example here).
NOTE: Reprojections typically require a lot of processing time, so expect this cell to run for up to 1 minute.
airborne_ir = airborne_ir.rio.reproject('EPSG:26912') # overwrite itself with new reprojected data arrayWarning 1: HTTP response code on https://snowex-tutorials.s3.us-west-2.amazonaws.com/thermal-ir/SNOWEX2020_IR_PLANE_2020Feb08_mosaicked_2020-02-08T181915.tif.msk: 403
Warning 1: HTTP response code on https://snowex-tutorials.s3.us-west-2.amazonaws.com/thermal-ir/SNOWEX2020_IR_PLANE_2020Feb08_mosaicked_2020-02-08T181915.tif.MSK: 403
airborne_ir.rio.crs # new CRSCRS.from_wkt('PROJCS["NAD83 / UTM zone 12N",GEOGCS["NAD83",DATUM["North_American_Datum_1983",SPHEROID["GRS 1980",6378137,298.257222101,AUTHORITY["EPSG","7019"]],AUTHORITY["EPSG","6269"]],PRIMEM["Greenwich",0,AUTHORITY["EPSG","8901"]],UNIT["degree",0.0174532925199433,AUTHORITY["EPSG","9122"]],AUTHORITY["EPSG","4269"]],PROJECTION["Transverse_Mercator"],PARAMETER["latitude_of_origin",0],PARAMETER["central_meridian",-111],PARAMETER["scale_factor",0.9996],PARAMETER["false_easting",500000],PARAMETER["false_northing",0],UNIT["metre",1,AUTHORITY["EPSG","9001"]],AXIS["Easting",EAST],AXIS["Northing",NORTH],AUTHORITY["EPSG","26912"]]')Next, the filename shows us when this imagery was taken in UTC time, “2020-02-08T181915”
We can create a pandas timestamp variable in local time for comparison with other datasets:
# Create a pandas timestamp, subtract 7 hours from UTC time to get local time (MST, UTC-7)
airborne_ir_timestamp = pd.Timestamp(2020,2,8,18,19,15) - pd.Timedelta(hours=7)
/tmp/ipykernel_4399/1783445607.py:2: DeprecationWarning: The 'generic' unit for NumPy timedelta is deprecated, and will raise an error in the future. This includes implicit conversion of bare integers (e.g. `+ 1`). Please use a specific unit instead.
airborne_ir_timestamp = pd.Timestamp(2020,2,8,18,19,15) - pd.Timedelta(hours=7)
What color scale should we use for temperature?
Common advice you may have heard is to avoid using rainbow color scales. Luckily matplotlib gives us lots of options to choose from.
When representing images of temperature, sometimes we want to pick colors that intuitively suggest temperature, such as the “magma” colorbar below. Other times we might be interested in both magnitude and sign, such as temperatures above or below melting point, in which case we could use something like “RdBu_r” below. I often pick simple greyscale, though less visually interesting, it is sometimes easier to pick out details in a continuous color scale like they “Greys” scale below. Make sure to include a labeled colorbar so your plot can be correctly interpreted!

Some matplotlib color scale options (top to bottom): “magma”, “RdBu_r”, “Greys”
Plot the airborne TIR image.
What does our chosen colorscale tell us about temperatures here?
What can we see?
fig, ax = plt.subplots(figsize=(20,10)) # create a new matplotlib figure, set the figure size
ax.set_aspect('equal') # set the aspect ratio to "equal"

# plot the airborne infrared image
airborne_ir.plot(cmap='magma', vmin=-10, vmax=10,ax=ax,
                 cbar_kwargs={'label': r'Temperature $\degree C$'})

# set axes labels
ax.set_xlabel('Eastings UTM 12N (m)')
ax.set_ylabel('Northings UTM 12N (m)')

ax.set_title('Airborne TIR imagery of Grand Mesa, CO (Feb. 8, 2020)');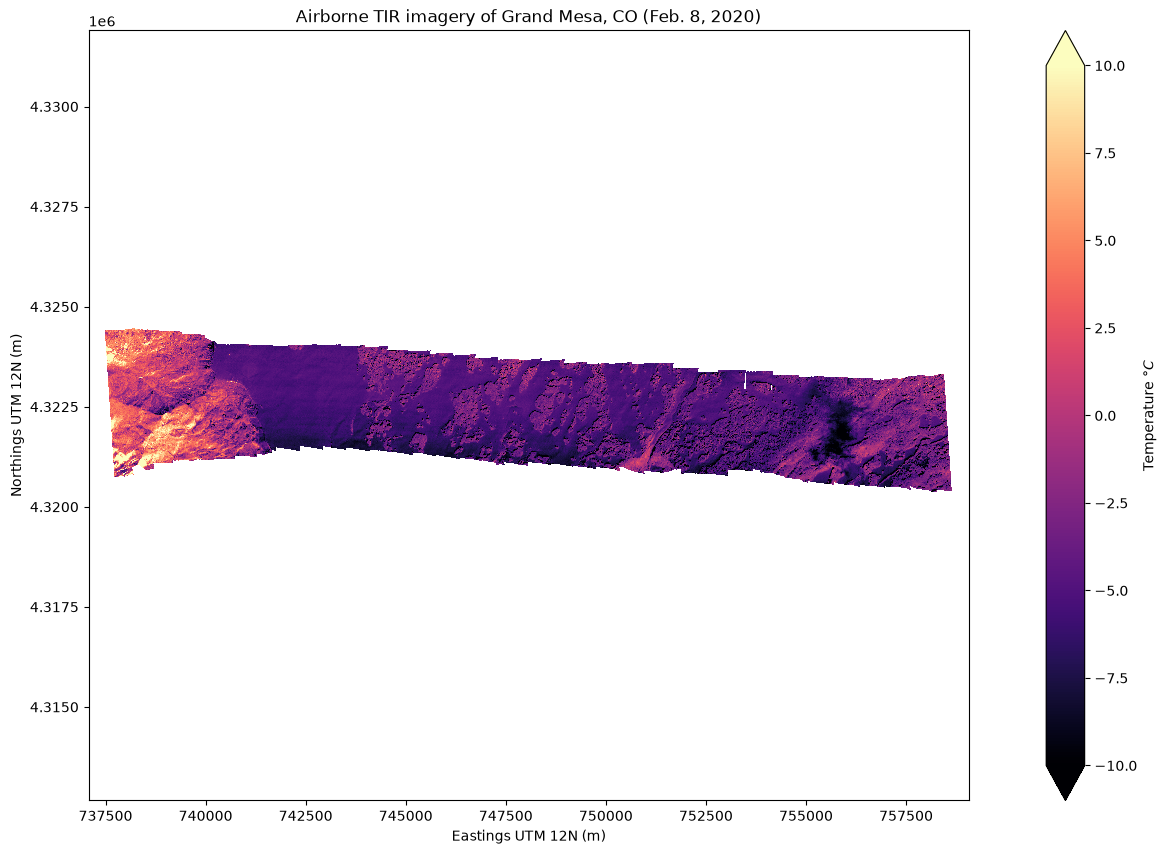
Bonus activity:
To help with our image interpretation, we can load visible imagery taken concurrently from the UW-APL airborne instrument. (Note: this example image is a single band black and white image, though we also have full RGB images available through NSIDC)
airborne_vis = rioxarray.open_rasterio(S3_BASE_URL + 'SNOWEX2020_EO_PLANE_2020Feb08_mosaicked_2020-02-08T181915.tif')

# note that the filename is identical with the same timestamp, but is labeled "EO" (electro-optical) rather than "IR" (infrared)
Warning 1: HTTP response code on https://snowex-tutorials.s3.us-west-2.amazonaws.com/thermal-ir/SNOWEX2020_EO_PLANE_2020Feb08_mosaicked_2020-02-08T181915.hdr: 403
Warning 1: HTTP response code on https://snowex-tutorials.s3.us-west-2.amazonaws.com/thermal-ir/SNOWEX2020_EO_PLANE_2020Feb08_mosaicked_2020-02-08T181915.HDR: 403
Warning 1: HTTP response code on https://snowex-tutorials.s3.us-west-2.amazonaws.com/thermal-ir/SNOWEX2020_EO_PLANE_2020Feb08_mosaicked_2020-02-08T181915.IMD: 403
Warning 1: HTTP response code on https://snowex-tutorials.s3.us-west-2.amazonaws.com/thermal-ir/SNOWEX2020_EO_PLANE_2020Feb08_mosaicked_2020-02-08T181915.imd: 403
Warning 1: HTTP response code on https://snowex-tutorials.s3.us-west-2.amazonaws.com/thermal-ir/SNOWEX2020_EO_PLANE_2020Feb08_mosaicked_2020-02-08T181915.RPB: 403
Warning 1: HTTP response code on https://snowex-tutorials.s3.us-west-2.amazonaws.com/thermal-ir/SNOWEX2020_EO_PLANE_2020Feb08_mosaicked_2020-02-08T181915.rpb: 403
Warning 1: HTTP response code on https://snowex-tutorials.s3.us-west-2.amazonaws.com/thermal-ir/SNOWEX2020_EO_PLANE_2020Feb08_mosaicked_2020-02-08T181915.PVL: 403
Warning 1: HTTP response code on https://snowex-tutorials.s3.us-west-2.amazonaws.com/thermal-ir/SNOWEX2020_EO_PLANE_2020Feb08_mosaicked_2020-02-08T181915.pvl: 403
Warning 1: HTTP response code on https://snowex-tutorials.s3.us-west-2.amazonaws.com/thermal-ir/SNOWEX2020_EO_PLANE_2020Feb08_mosaicked_2020-02-08T181915_rpc.txt: 403
Warning 1: HTTP response code on https://snowex-tutorials.s3.us-west-2.amazonaws.com/thermal-ir/SNOWEX2020_EO_PLANE_2020Feb08_mosaicked_2020-02-08T181915_RPC.TXT: 403
Warning 1: HTTP response code on https://snowex-tutorials.s3.us-west-2.amazonaws.com/thermal-ir/SNOWEX2020_EO_PLANE_2020Feb08_mosaicked_2020-02-08T181915_metadata.txt: 403
Warning 1: HTTP response code on https://snowex-tutorials.s3.us-west-2.amazonaws.com/thermal-ir/SNOWEX2020_EO_PLANE_2020Feb08_mosaicked_2020-02-08T181915_METADATA.txt: 403
Warning 1: HTTP response code on https://snowex-tutorials.s3.us-west-2.amazonaws.com/thermal-ir/SNOWEX2020_EO_PLANE_2020Feb08_mosaicked_2020-02-08T181915_MTL.txt: 403
Warning 1: HTTP response code on https://snowex-tutorials.s3.us-west-2.amazonaws.com/thermal-ir/SNOWEX2020_EO_PLANE_2020Feb08_mosaicked_2020-02-08T181915_MTL.TXT: 403
Warning 1: HTTP response code on https://snowex-tutorials.s3.us-west-2.amazonaws.com/thermal-ir/SNOWEX2020_EO_PLANE_2020Feb08_mosaicked_2020-02-08T181915_metadata.xml: 403
Warning 1: HTTP response code on https://snowex-tutorials.s3.us-west-2.amazonaws.com/thermal-ir/SNOWEX2020_EO_PLANE_2020Feb08_mosaicked_2020-02-08T181915_METADATA.XML: 403
Warning 1: HTTP response code on https://snowex-tutorials.s3.us-west-2.amazonaws.com/thermal-ir/SNOWEX2020_EO_PLANE_2020Feb08_mosaicked_2020-02-08T181915.TXT: 403
Warning 1: HTTP response code on https://snowex-tutorials.s3.us-west-2.amazonaws.com/thermal-ir/SNOWEX2020_EO_PLANE_2020Feb08_mosaicked_2020-02-08T181915.txt: 403
Warning 1: HTTP response code on https://snowex-tutorials.s3.us-west-2.amazonaws.com/thermal-ir/SNOWEX2020_EO_PLANE_2020Feb08_mosaicked_2020-02-08T181915.RPC: 403
Warning 1: HTTP response code on https://snowex-tutorials.s3.us-west-2.amazonaws.com/thermal-ir/SNOWEX2020_EO_PLANE_2020Feb08_mosaicked_2020-02-08T181915.rpc: 403
Warning 1: HTTP response code on https://snowex-tutorials.s3.us-west-2.amazonaws.com/thermal-ir/HDR2020_EO_PLANE_2020Feb08_mosaicked_2020-02-08T181915.txt: 403
Warning 1: HTTP response code on https://snowex-tutorials.s3.us-west-2.amazonaws.com/thermal-ir/HDR2020_EO_PLANE_2020Feb08_mosaicked_2020-02-08T181915.TXT: 403
Warning 1: HTTP response code on https://snowex-tutorials.s3.us-west-2.amazonaws.com/thermal-ir/HDRWEX2020_EO_PLANE_2020Feb08_mosaicked_2020-02-08T181915.txt: 403
Warning 1: HTTP response code on https://snowex-tutorials.s3.us-west-2.amazonaws.com/thermal-ir/HDRWEX2020_EO_PLANE_2020Feb08_mosaicked_2020-02-08T181915.TXT: 403
Warning 1: HTTP response code on https://snowex-tutorials.s3.us-west-2.amazonaws.com/thermal-ir/RPC2020_EO_PLANE_2020Feb08_mosaicked_2020-02-08T181915.txt: 403
Warning 1: HTTP response code on https://snowex-tutorials.s3.us-west-2.amazonaws.com/thermal-ir/RPC2020_EO_PLANE_2020Feb08_mosaicked_2020-02-08T181915.TXT: 403
Warning 1: HTTP response code on https://snowex-tutorials.s3.us-west-2.amazonaws.com/thermal-ir/RPCWEX2020_EO_PLANE_2020Feb08_mosaicked_2020-02-08T181915.txt: 403
Warning 1: HTTP response code on https://snowex-tutorials.s3.us-west-2.amazonaws.com/thermal-ir/RPCWEX2020_EO_PLANE_2020Feb08_mosaicked_2020-02-08T181915.TXT: 403
# Also reproject the airborne visible imagery into EPSG:26912
airborne_vis = airborne_vis.rio.reproject('EPSG:26912') # overwrite itself with new reprojected data array
Warning 1: HTTP response code on https://snowex-tutorials.s3.us-west-2.amazonaws.com/thermal-ir/SNOWEX2020_EO_PLANE_2020Feb08_mosaicked_2020-02-08T181915.tif.msk: 403
Warning 1: HTTP response code on https://snowex-tutorials.s3.us-west-2.amazonaws.com/thermal-ir/SNOWEX2020_EO_PLANE_2020Feb08_mosaicked_2020-02-08T181915.tif.MSK: 403
airborne_visPlot the visible and infrared images side by side. This time, we will change the x and y axes limits (set_xlim, and set_ylim) to zoom in closer.
fig, axs = plt.subplots(nrows=2, ncols=1, figsize=(20,10), tight_layout=True)

# Plot the IR imagery
airborne_ir.plot(ax=axs[0],
                 cmap='magma',
                 vmin=-10, vmax=10,
                 cbar_kwargs={'label': r'Temperature $\degree C$'})
axs[0].set_title('Airborne IR')

# Plot the visible imagery
airborne_vis.plot(ax=axs[1],
                  cmap='Greys_r',
                  cbar_kwargs={'label': 'DN'})
axs[1].set_title('Airborne Vis')

# for each subplot, do the following:
for ax in axs:
    ax.set_aspect('equal') # set the aspect ratio to "equal"

    # give each axis a label
    ax.set_xlabel('Eastings UTM 12N (m)')
    ax.set_ylabel('Northings UTM 12N (m)')

    # set the axes limits, units in meters UTM Zone 12N (I chose these values by just looking at the plot above)
    ax.set_xlim((735000, 760000)) # x axis limits
    ax.set_ylim((4320000, 4325000)) # y axis limits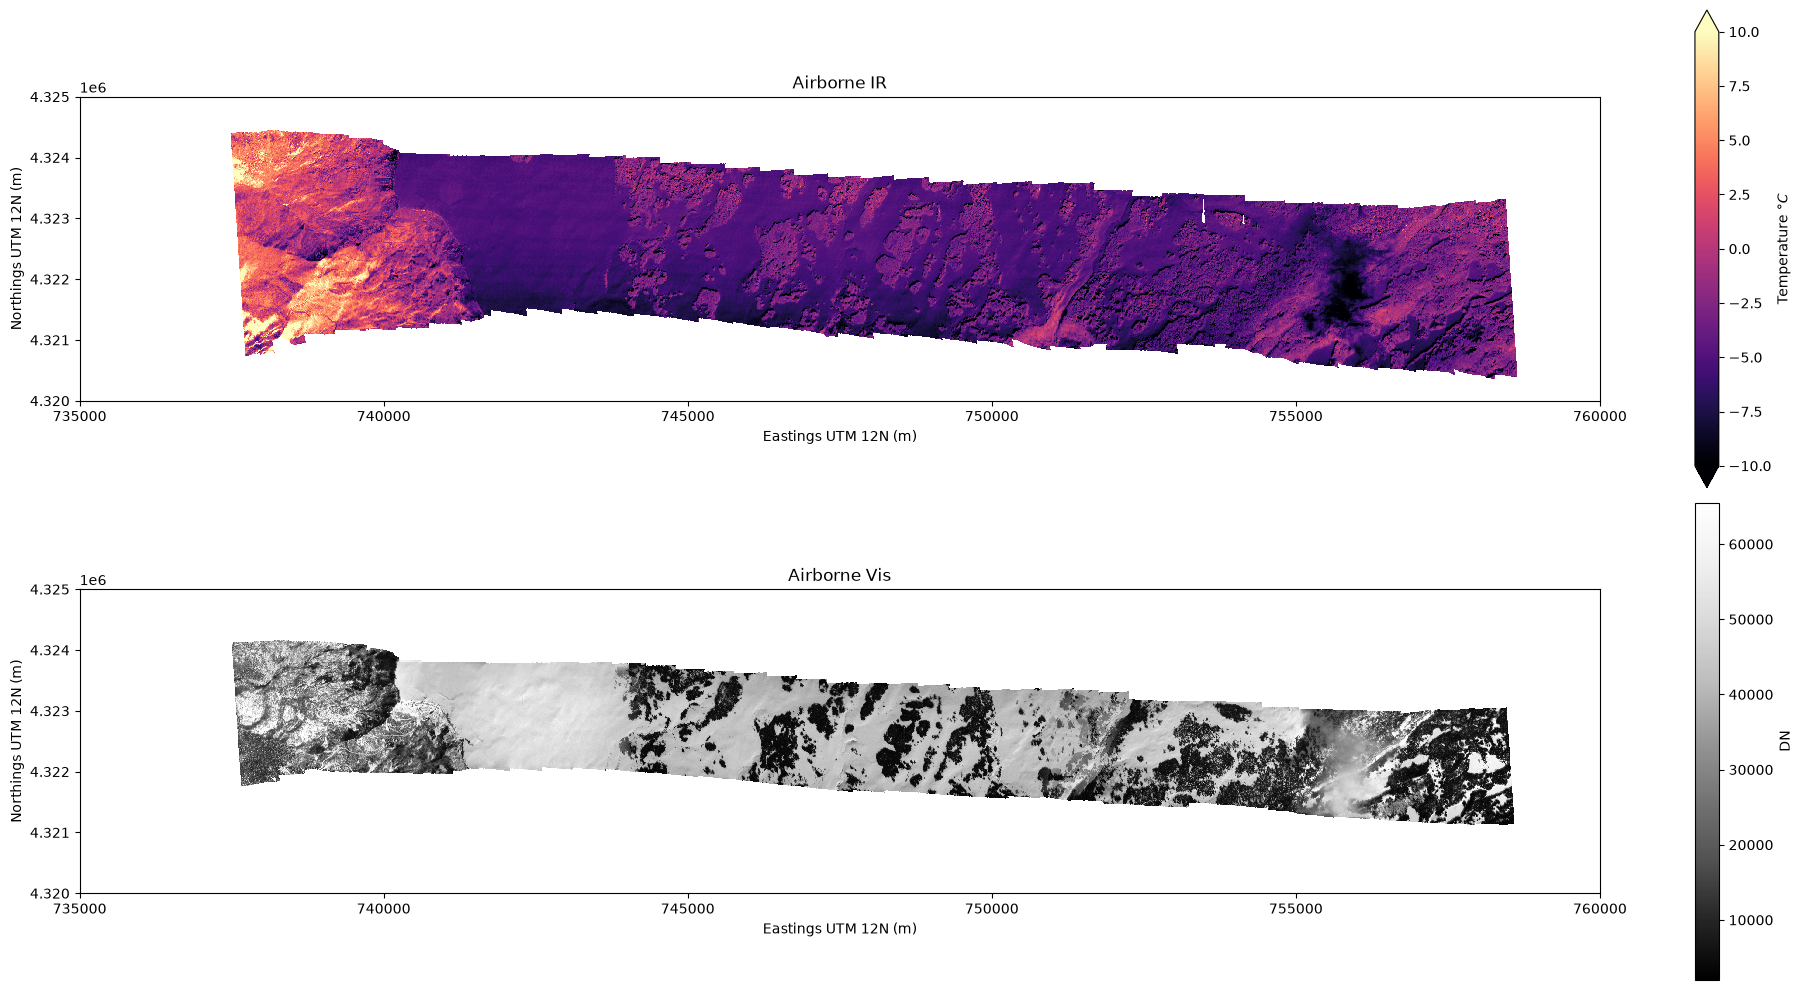
Ground-based temperature observations
To provide a source of “ground truth” for the airborne and satellite thermal infrared images during the SnowEx 2020 Grand Mesa campaign, we can use ground-based snow surface temperature measurements. On February 5, 2020, we installed a thermal infrared radiometer pointing at the snow surface at snow pit #2S10 (left), and buried temperature sensors beneath the snow surface (right). These logged observations at 5-minute intervals until we removed the instrumentation a week later on February 12.
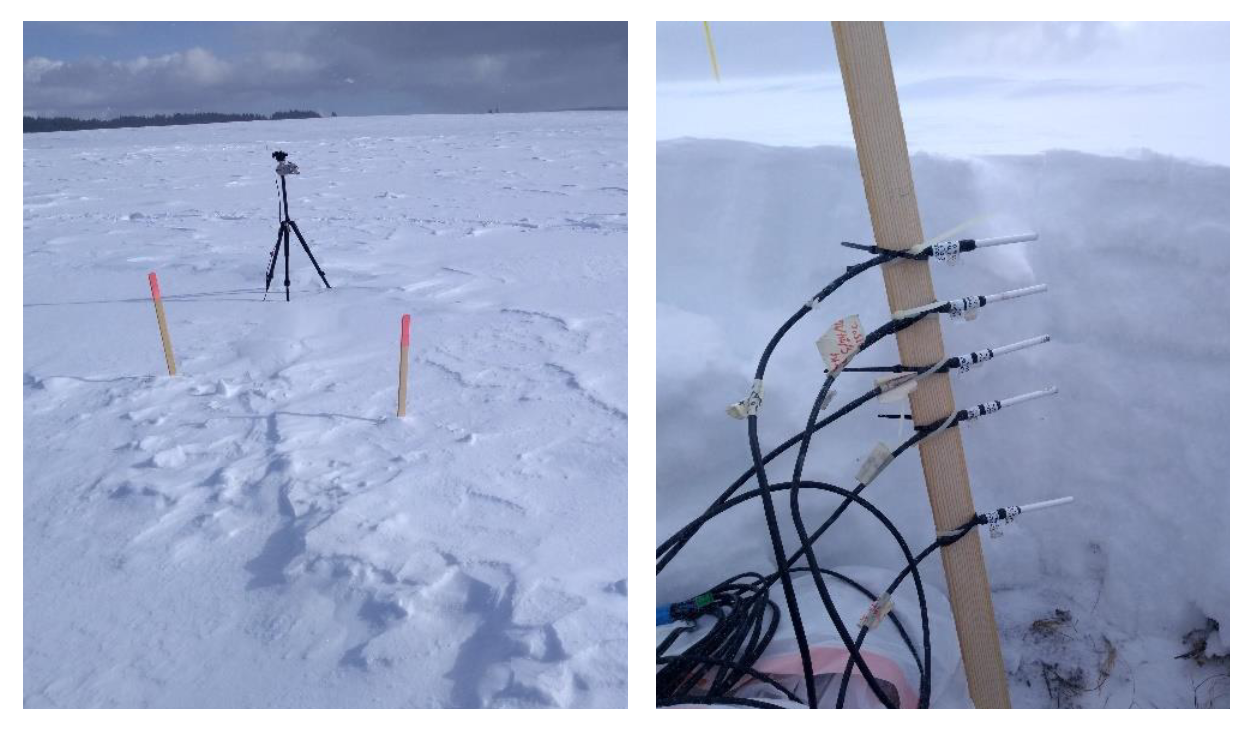
Snow temperature sensor setup at snow pit 2S10: (left) tripod-mounted thermal ifrared radiometer to measure snow surface, (right) temperature probes to be buried beneath the snow surface. (Photos by Steven Pestana)
What are some of the differences we might expect to see between the ground-based surface temperature data and the thermal IR images?
Emissivity differences?
Our ground-based radiometer was looking at 45 deg off nadir, versus nadir ASTER versus variable view angle airborne (snow emissivity changes off-nadir)
Different TIR bandwidths (broad versus narrow)?
Ground-based radiometer: 8-14 μm, Airborne IR cameras: 8-14 μm, ASTER band 14: 10.95-11.65 µm
Different atmospheric path lengths?
From <1 meter, to 1 km, to entire atmospheric column (~100 km)
“Point” versus area, and geolocation accuracy
The ground-based radiometer is measuring temperature for a spot (not really a single point) maybe ~1m in diameter. The airborne and ASTER imagers have spatial resolutions of 5m and 90m respectively. How confident are we in the geolocation of individual pixels in the imagery?
Where is snow pit 2S10?
We can find this information through a query to the SnowEx SQL database. First, set up the connection:
# Initialize client
client = SnowExLambdaClient()

# Get all measurement classes dynamically
classes = client.get_measurement_classes()
LayerMeasurements = classes['LayerMeasurements']

print("🔍 Testing Lambda connection...")
connection_test = client.test_connection()
print(f"✅ Connected: {connection_test.get('connected', False)}")
if connection_test.get('connected'):
    print(f"📊 Database: {connection_test.get('version', 'Unknown version')}")
else:
    print("❌ Connection failed")
🔍 Testing Lambda connection...
✅ Connected: True
📊 Database: PostgreSQL 16.10 on x86_64-conda-linux-gnu, compiled by x86_64-conda-linux-gnu-cc (conda-forge gcc 14.3.0-4) 14.3.0, 64-bit
Then, set up a query to find the entry with the site ID that we want (2S10). Preview the resulting geodataframe.
# Get all sites containing '2S10'
sites_with_2S10 = [site for site in LayerMeasurements.all_sites if '2S10' in site]
print(f"Found {len(sites_with_2S10)} sites containing '2S10':")
siteLocations = LayerMeasurements.get_sites(site_names=sites_with_2S10)
siteLocations
siteData_df = siteLocations
Found 1 sites containing '2S10':
Inspect of the geodatframe’s metadata
# What is the coordinate reference system used here?
siteData_df.crs
<Geographic 2D CRS: EPSG:4326>
Name: WGS 84
Axis Info [ellipsoidal]:
- Lat[north]: Geodetic latitude (degree)
- Lon[east]: Geodetic longitude (degree)
Area of Use:
- name: World.
- bounds: (-180.0, -90.0, 180.0, 90.0)
Datum: World Geodetic System 1984 ensemble
- Ellipsoid: WGS 84
- Prime Meridian: Greenwich# Preview the geometry of this geodataframe, we should see that it is a POINT
siteData_df.geometry0 POINT (-108.19232 39.01947)
Name: geometry, dtype: geometryWe can now plot our snow pit site from this geodataframe on top of the airborne IR image. Note we will first have to reproject the snow pit location to UTM12N since it is currently in geographic coordinates. (See more tips about plotting geodataframes here)
fig, ax = plt.subplots(figsize=(20,5)) # create a new matplotlib figure, set the figure size
ax.set_aspect('equal') # set the aspect ratio to "equal"

# plot the airborne infrared image
airborne_ir.plot(cmap='magma', vmin=-10, vmax=10, ax=ax,
                 cbar_kwargs={'label': r'Temperature $\degree C$'})

# Reproject siteData_df to match airborne_ir's CRS (EPSG:26912)
siteData_df = siteData_df.to_crs('EPSG:26912')

# plot the location of the snow pit of interest
siteData_df.plot(ax=ax, color='r', marker='x')

# set axes labels
ax.set_xlabel('Eastings UTM 12N (m)')
ax.set_ylabel('Northings UTM 12N (m)')

# set the axes limits, units in meters UTM Zone 12N (I chose these values by just looking at the plot above)
ax.set_xlim((735000, 760000)) # x axis limits
ax.set_ylim((4320000, 4325000)) # y axis limits

# set plot title
ax.set_title('Location of Snow Pit 2S10\nwith Airborne TIR imagery of Grand Mesa, CO (Feb. 8, 2020)');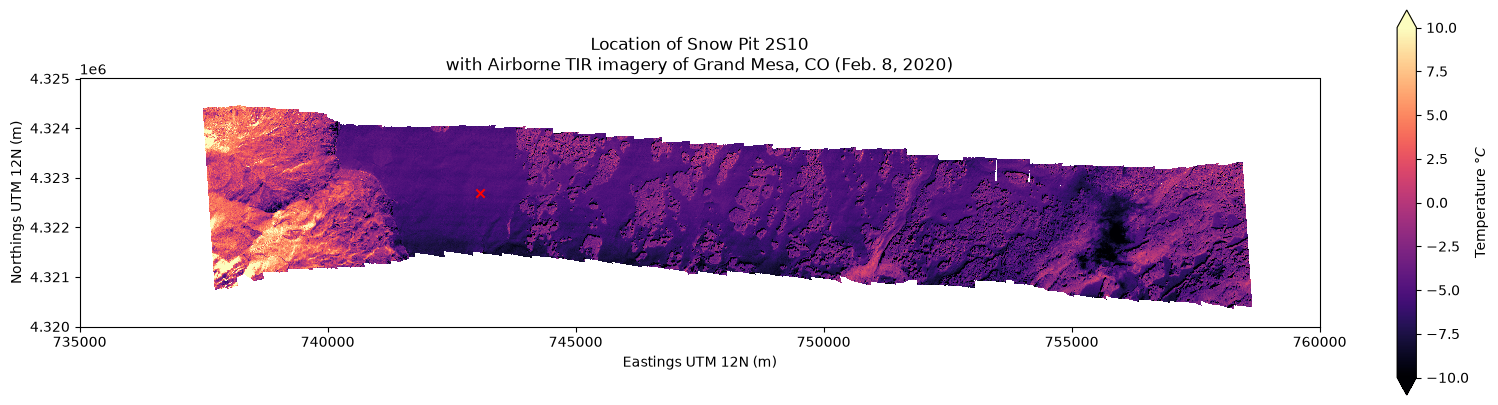
Change the x and y axes limits (set_xlim, and set_ylim) to zoom in to our point of interest. In this case we can use df
fig, ax = plt.subplots(figsize=(10,10)) # create a new matplotlib figure, set the figure size
ax.set_aspect('equal') # set the aspect ratio to "equal"

# plot the airborne infrared image
airborne_ir.plot(cmap='magma', vmin=-10, vmax=10, ax=ax,
                 cbar_kwargs={'label': r'Temperature $\degree C$'})

# plot the location of the snow pit of interest
siteData_df.plot(ax=ax, color='r', marker='x')

# set axes limits
xmin, ymin, xmax, ymax = siteData_df.geometry.total_bounds # get the "total bounds" for our geometry
ax.set_xlim((xmin-1000, xmax+1000)) # x axis limits to +/- 1 km from our point's "total bounds"
ax.set_ylim((ymin-1000, ymax+1000)) # y axis limits to +/- 1 km from our point's "total bounds"

# set axes labels
ax.set_xlabel('Eastings UTM 12N (m)')
ax.set_ylabel('Northings UTM 12N (m)')

# set plot title
ax.set_title('Location of Snow Pit 2S10\nAirborne TIR imagery of Grand Mesa, CO (Feb. 8, 2020)');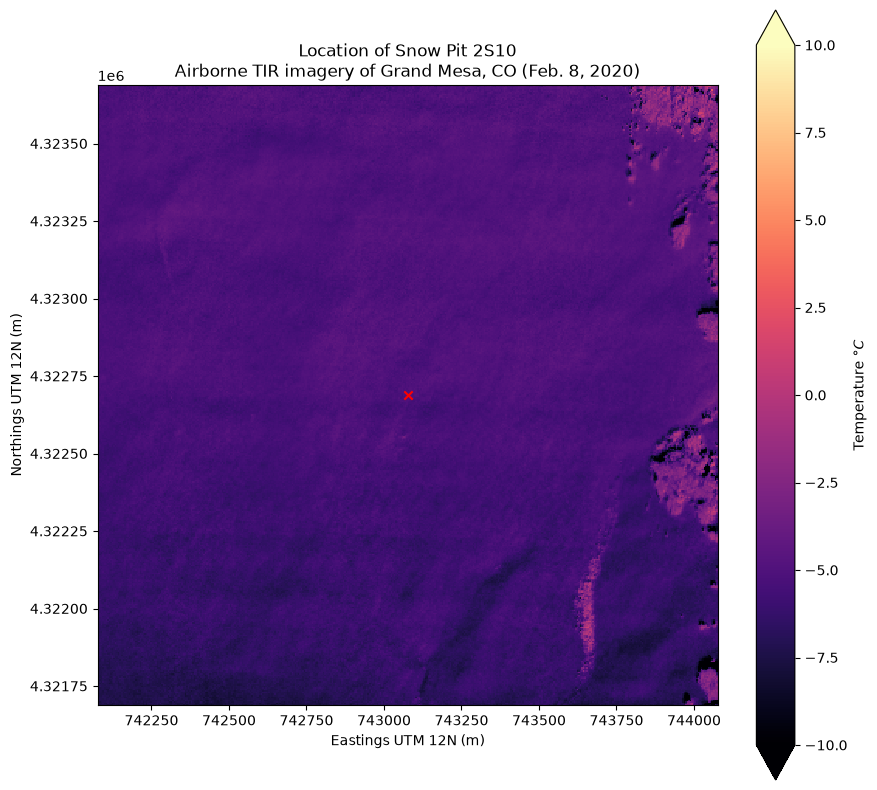
Import the snow temperature timeseries dataset
This data is available through NSIDC, but we have already downloaded a local copy for this tutorial.
The raw data file doesn’t include the column names, so we need to set the column headers following the dataset’s README file.
!cat data/snow-temperature-README.txtDescription:
This folder contains data files from two Campbell Scientific CR10X dataloggers which were installed at two sites on Grand Mesa to measure snow temperature profiles as part of the SnowEx 2020 field campaign.
"Grand Mesa 1" (GM1) measured snow surface temperature with an Apogee SI-111 thermal infrared radiometer mounted on a tripod at a height of about 127 cm above the snow surface. The radiometer pointed 45 degrees off-nadir at the snow surface just to the west of the tripod. Five Campbell Scientific temperature probes were mounted vertically along a wooden stake with zip ties, at depths of 5, 10, 15, 20, and 30 cm below the snow surface. (CR10X_GM1_final_storage_1.dat)
"Grand Mesa 2" (GM2) measured snow temperatures with five temperature probes mounted vertically on a wooden stake with zip ties at depths of 5, 10, 15, 20, and 30 cm below the snow surface. This location was just outside the fence perimeter of the Mesa West met station (northwest of the met station tower). Snow surface temperature is measured at the Mesa West station by its own set of thermal infrared radiometers, which can provide snow surface temperature adjacent to this vertical profile of snow temperature. The Mesa West station should also be able to provide similar snow temperatures below the surface with its own string of temperature sensors.
Date/times:
GM1: 2-5-2020 11:12 AM MST (UTC−07:00) - 2-12-2020 3:36 PM MST (UTC−07:00)
GM2: 2-5-2020 12:35 PM MST (UTC−07:00) - 2-12-2020 2:36 PM MST (UTC−07:00)
Locations:
GM1 was located at Pit ID 2S10
GM2 was located at the Mesa West met station
File formats:
*.dat - comma-separated values from the Campbell Scientific CR10X Dataloggers
*.xlsx - MS Excel worksheet
Columns:
GM1:
'table', 'year', 'doy', 'time',
'rad_avg', 'rad_max', 'rad_min', 'rad_std',
'sb_avg', 'sb_max', 'sb_min', 'sb_std',
'temp1_avg', 'temp1_max', 'temp1_min', 'temp1_std',
'temp2_avg', 'temp2_max', 'temp2_min', 'temp2_std',
'temp3_avg', 'temp3_max', 'temp3_min', 'temp3_std',
'temp4_avg', 'temp4_max', 'temp4_min', 'temp4_std',
'temp5_avg', 'temp5_max', 'temp5_min', 'temp5_std',
'batt_a','batt_b'
GM2:
'table', 'year', 'doy', 'time',
'temp1_avg', 'temp1_max', 'temp1_min', 'temp1_std',
'temp2_avg', 'temp2_max', 'temp2_min', 'temp2_std',
'temp3_avg', 'temp3_max', 'temp3_min', 'temp3_std',
'temp4_avg', 'temp4_max', 'temp4_min', 'temp4_std',
'temp5_avg', 'temp5_max', 'temp5_min', 'temp5_std',
'batt_a','batt_b'
Resources:
An example jupyter notebook for reading and plotting the data is available on github:
https://github.com/spestana/snowex2020-snow-tempCreate a list of column headers according to the readme above (for “GM1” which we can read was the datalogger at snowpit 2S10)
column_headers = ['table', 'year', 'doy', 'time', # year, day of year, time of day (local time, UTC-7)
                  'rad_avg', 'rad_max', 'rad_min', 'rad_std', # radiometer surface temperature
                  'sb_avg', 'sb_max', 'sb_min', 'sb_std', # radiometer sensor body temperature (for calibration)
                  'temp1_avg', 'temp1_max', 'temp1_min', 'temp1_std', # temperature at 5 cm below snow surface
                  'temp2_avg', 'temp2_max', 'temp2_min', 'temp2_std', #               10 cm
                  'temp3_avg', 'temp3_max', 'temp3_min', 'temp3_std', #               15 cm
                  'temp4_avg', 'temp4_max', 'temp4_min', 'temp4_std', #               20 cm
                  'temp5_avg', 'temp5_max', 'temp5_min', 'temp5_std', #               30 cm
                  'batt_a','batt_b', # battery voltage data
                 ]
Open the file as a pandas data frame with read_csv
df = pd.read_csv(f'data/CR10X_GM1_final_storage_1.dat',
                 header = None, names = column_headers)

# After the filepath we specify header=None because the file doesn't contain column headers,
# then we specify names=column_headers to give our own names for each column.
We need to do some formatting of the data fields, but we can preview what we just loaded fist
df.head() # show the first 5 rows of the dataframeData cleanup and formatting
# Create a zero-padded time string (e.g. for 9:30 AM we are changing '930' into '0930')
df['time_str'] = [('0' * (4 - len(str(df.time[i])))) + str(df.time[i]) for i in range(df.shape[0])]

# locate where rows have time_str == 2400 (midnight), and the whole column 'doy'
# where we are at midnight, we need to shift one day forward
df.loc[df['time_str'] == '2400','doy'] += 1

# and then change midnight from '2400' to '0000'
df.time_str.replace('2400', '0000', inplace=True)
This function lets us convert year and day of year (the format that the datalogger uses) to a pandas datetime index:
def compose_date(years, months=1, days=1, weeks=None, hours=None, minutes=None,
                 seconds=None, milliseconds=None, microseconds=None, nanoseconds=None):
    '''Compose a datetime object from various datetime components. This clever solution is from:
        https://stackoverflow.com/questions/34258892/converting-year-and-day-of-year-into-datetime-index-in-pandas'''
    years = np.asarray(years) - 1970
    months = np.asarray(months) - 1
    days = np.asarray(days) - 1
    types = ('<M8[Y]', '<m8[M]', '<m8[D]', '<m8[W]', '<m8[h]',
             '<m8[m]', '<m8[s]', '<m8[ms]', '<m8[us]', '<m8[ns]')
    vals = (years, months, days, weeks, hours, minutes, seconds,
            milliseconds, microseconds, nanoseconds)
    return sum(np.asarray(v, dtype=t) for t, v in zip(types, vals)
               if v is not None)
# Create a datetime value from the date field and zero-padded time_str field, set this as our dataframe's index
df.index = compose_date(df['year'],
days=df['doy'],
hours=df['time_str'].str[:2],
minutes=df['time_str'].str[2:])
# Remove entries that are from table "102" (this contains datalogger battery information we're not interested in at the moment)
df = df[df.table != 102]
# drop the columns we no longer need
df.drop(columns=['table','year','doy','time','time_str','batt_a','batt_b'], inplace=True)/tmp/ipykernel_4399/3645742961.py:12: DeprecationWarning: The 'generic' unit for NumPy timedelta is deprecated, and will raise an error in the future. This includes implicit conversion of bare integers (e.g. `+ 1`). Please use a specific unit instead.
return sum(np.asarray(v, dtype=t) for t, v in zip(types, vals)
Inspect the contents
df.head()Make a simple plot of the data. We are interested in the variable rad_avg which is the average temperature measured by the radiometer over each 5 minute period.
plt.figure(figsize=(10,4))

# plot radiometer average temperature
df.rad_avg.plot(linestyle='-', marker='', markersize=1, c='k', label='Ground-based $T_s$')


# set axes limits
plt.ylim((-35,5))
plt.xlim((pd.Timestamp(2020,2,5,11,0),pd.Timestamp(2020,2,12,16,0)))

# add a legend to the plot
plt.legend()

# set axes labels
plt.ylabel(r'Temperature [$C\degree$]')
plt.xlabel('Time')

# add grid lines to the plot
plt.grid('on')

# set the plot title
plt.title('Snow Surface Temperature at Snow Pit 2S10');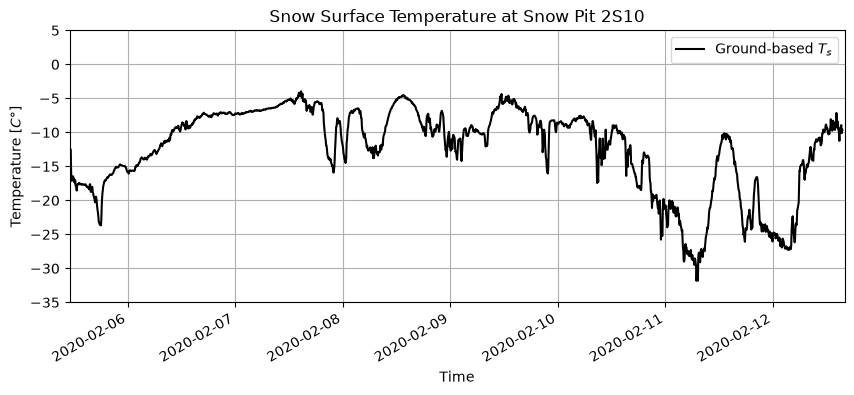
Bonus plot: look at snow temperatures below the snow surface
Add the following to the above plot to add lines for temperature recorded at each depth interval below the snow surface:
# plot the snow temperature at each depth it was measured
df.temp1_avg.plot(linestyle='-', marker='.', markersize=1, c=[0.8,0.8,1], label='Ts @ -5 cm')
df.temp2_avg.plot(linestyle='-', marker='.', markersize=1, c=[0.6,0.6,1], label='Ts @ -10 cm')
df.temp3_avg.plot(linestyle='-', marker='.', markersize=1, c=[0.4,0.4,1], label='Ts @ -15 cm')
df.temp4_avg.plot(linestyle='-', marker='.', markersize=1, c=[0.2,0.2,1], label='Ts @ -20 cm')
df.temp5_avg.plot(linestyle='-', marker='.', markersize=1, c=[0,0,1], label='Ts @ -30 cm')
But then we want to focus on the date/time when our IR image was from, so zoom in on Feb 8th by changing our plot’s xlim (using pandas Timestamps for the x axis values).
plt.figure(figsize=(10,4))

# plot radiometer average temperature
df.rad_avg.plot(linestyle='-', marker='', markersize=1, c='k', label='Ground-based $T_s$')

# set axes limits
plt.ylim((-15,0)) # set some temperature y-axis limits for our plot
plt.xlim((pd.Timestamp(2020,2,8,6,0),pd.Timestamp(2020,2,8,20,0))) # zoom in to daytime hours on Feb. 8, 2020

# add a legend to the plot
plt.legend()

# set axes labels
plt.ylabel(r'Temperature [$C\degree$]')
plt.xlabel('Time')

# add grid lines to the plot
plt.grid('on')

# set the plot title
plt.title('Snow Surface Temperature at Snow Pit 2S10');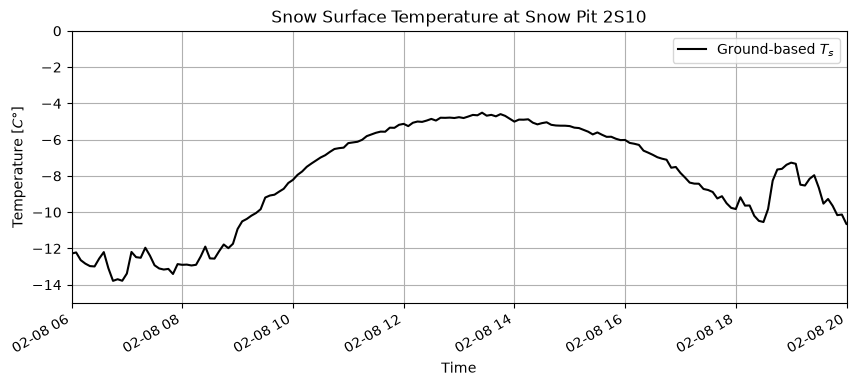
Compare Airborne IR against the “ground truth” snow surface temperature
What is the temperature at this point in the airborne IR image?
Use rioxarray’s clip function to extract the raster values that intersect with the point’s geometry. Because we have a point, this will return a single value for the pixel that overlaps this point.
# clip using our point's geometry
airborne_ir_point_temperature = airborne_ir.rio.clip(siteData_df.geometry)

# preview the result
airborne_ir_point_temperatureOur result is a DataArray with a single data value at one set of x and y coordinates.
Add a 100 m radius buffer around this point and get the temperature from the airborne imagery for a larger area around the snow pit.
r = 100 # radius of the buffer in meters (this is in meters because we are working in a UTM coordinate reference system)

# create the buffered geometry
siteData_df_buffer = siteData_df.buffer(r)

# preview the resulting geometry, we should see this is a POLYGON now
siteData_df_buffer
0 POLYGON ((743176.188 4322688.736, 743175.706 4...
dtype: geometryWhat does this polygon look like when we plot it on top of the airborne IR image now?
fig, ax = plt.subplots(figsize=(10,10)) # create a new matplotlib figure, set the figure size
ax.set_aspect('equal') # set the aspect ratio to "equal"

# plot the airborne infrared image
airborne_ir.plot(cmap='magma', vmin=-10, vmax=10, ax=ax,
                 cbar_kwargs={'label': r'Temperature $\degree C$'})

# plot the location of the snow pit of interest
siteData_df.plot(ax=ax, color='r', marker='x')

# plot the area of the buffer we made around the snow pit
siteData_df_buffer.plot(ax=ax, edgecolor='r', facecolor='none')

# set the same axes limits as above
ax.set_xlim((xmin-1000, xmax+1000)) # x axis limits to +/- 1 km from our point's "total bounds"
ax.set_ylim((ymin-1000, ymax+1000)) # y axis limits to +/- 1 km from our point's "total bounds"

# set axes labels
ax.set_xlabel('Eastings UTM 12N (m)')
ax.set_ylabel('Northings UTM 12N (m)')

# set plot title
ax.set_title('Location of Snow Pit 2S10, and 100 m radius buffer\nwith ASTER Band 14 TIR imagery');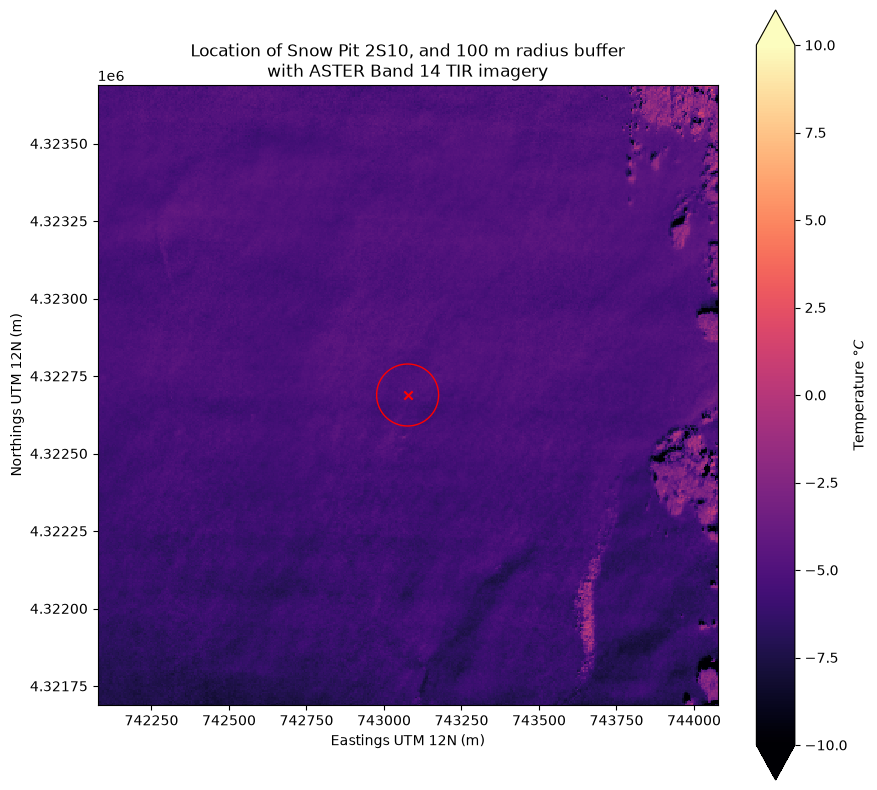
Clip the airborne IR raster again, now with our 200 m diameter polygon around the snow pit site.
# clip using our new geometry
airborne_ir_area_temperature = airborne_ir.rio.clip(siteData_df_buffer.geometry)

# preview the result
airborne_ir_area_temperatureThe result of clipping is again a DataArray, this time though it is 40x40. We can plot this to see what it looks like, and to see the distribution of temperatures in the area.
fig, ax = plt.subplots(nrows=1, ncols=2, figsize=(10,5), tight_layout=True)

# plot the portion of the airborne TIR image we selected within the buffer area geometry
airborne_ir_area_temperature.plot(cmap='magma', vmin=-7, vmax=-4, ax=ax[0],
                 cbar_kwargs={'label': r'Temperature $\degree C$'})
ax[0].set_title('Airborne TIR image within\n100 m radius buffer (2S10)\n')
ax[0].set_aspect('equal')
ax[0].set_xlabel('Eastings UTM 12N (m)')
ax[0].set_ylabel('Northings UTM 12N (m)')
ax[0].set_xlim((xmin-150, xmax+150)) # x axis limits to +/- 150 m from our point's "total bounds"
ax[0].set_ylim((ymin-150, ymax+150)) # y axis limits to +/- 150 m from our point's "total bounds"

# plot the location of the snow pit of interest to the plot
siteData_df.plot(ax=ax[0], color='c', marker='x')

# plot the area of the buffer we made around the snow pit
siteData_df_buffer.plot(ax=ax[0], edgecolor='c', facecolor='none')

# plot a histogram of image temperature data within the buffer area geometry
airborne_ir_area_temperature.plot.hist(ax=ax[1],
                                       color='k',
                                       zorder=1, # use zorder to make sure this plots below the point
                                       label='zonal $T_S$ histogram')

# plot a vertical line for the single-pixel temperature we think is right at the snow pit
ax[1].axvline(airborne_ir_point_temperature,
              color='c',linestyle='--',  # set color and style
              zorder=2, # use zorder to make sure this plots on top of the histogram
              label='$T_S$ single pixel')

# plot a vertical line for the mean temperature within the buffer area geometry
ax[1].axvline(airborne_ir_area_temperature.mean(),
              color='m',linestyle='--',  # set color and style
              zorder=2, # use zorder to make sure this plots on top of the histogram
              label='zonal mean $T_S$')

ax[1].legend(loc='upper left') # add a legend
ax[1].set_xlim((-7,-4)) # set xlim to same values as colorbar in image plot
ax[1].set_ylim((0,400)) # set ylim
ax[1].set_title('Snow surface temperatures\nfrom Airborne TIR image (snow pit 2S10)')
ax[1].set_ylabel('Number of pixels');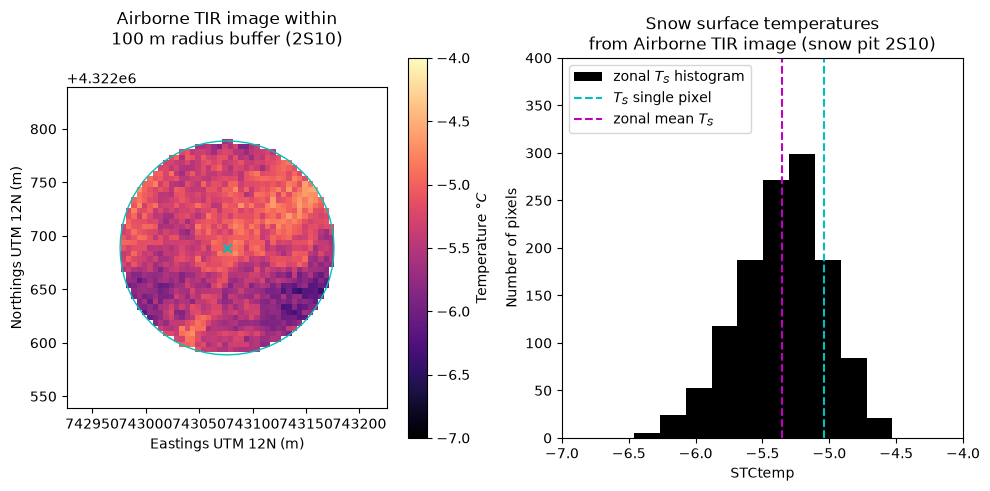
What do these plots tell us about the surface temperature around the snow pit as measured by the airborne IR cameras?
Is the snow surface temperature more variable or uniform in this area?
Note that we changed the minimum and maximum values of our colorbar!
Try computing the standard deviation of temperatures in this area
How does our single pixel at the center compare with the rest of this area?
Try taking the mean or median of all temperatures in the area and compare against the single point. What is the difference?
See Lundquist et al., 2018 for an application of these methods with airborne and MODIS thermal infrared imagery
Plot the airborne IR temperature data on top of the ground-based timeseries
plt.figure(figsize=(10,4))

# plot radiometer average temperature
df.rad_avg.plot(linestyle='-', marker='', markersize=1, c='k', label='Ground-based $T_s$')

# plot the mean airborne IR temperature from the area around the snow pit:
plt.plot(airborne_ir_timestamp, airborne_ir_area_temperature.mean(),
         marker='o', c='r', linestyle='none',
         label='Airborne IR mean $T_s$ for 100 m radius area')

# plot an error bar showing the maximum and minimum airborne IR temperature around the snow pit
plt.errorbar(airborne_ir_timestamp, airborne_ir_area_temperature.mean(),
             yerr=[[airborne_ir_area_temperature.mean()-airborne_ir_area_temperature.min()],
                   [airborne_ir_area_temperature.max()-airborne_ir_area_temperature.mean()]],
            capsize=3, fmt='none', ecolor='r',
            label='Airborne IR $T_s$ range for 100 m radius area')


# set axes limits
plt.ylim((-15,0))
plt.xlim((pd.Timestamp(2020,2,8,6,0),pd.Timestamp(2020,2,8,20,0))) # zoom in to daytime hours on Feb. 8, 2020

# add a legend to the plot
plt.legend()

# set axes labels
plt.ylabel(r'Temperature [$C\degree$]')
plt.xlabel('Time')

# add grid lines to the plot
plt.grid('on')

# set the plot title
plt.title('Snow Surface Temperature at Snow Pit 2S10');
/tmp/ipykernel_4399/1336368688.py:7: UserWarning: This axis already has a converter set and is updating to a potentially incompatible converter
plt.plot(airborne_ir_timestamp, airborne_ir_area_temperature.mean(),
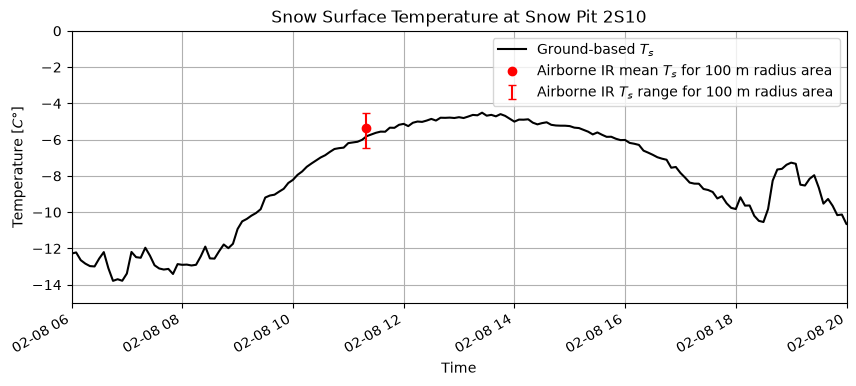
Continuing with this analysis:
In the above plot we’ve added “error bars” to represent the full range of temperatures within the 100 m radius area around the snow pit.
Is this a fair comparison?
Should we make the area smaller based on our confidence in the image’s geolocation accuracy (10-15 m)?
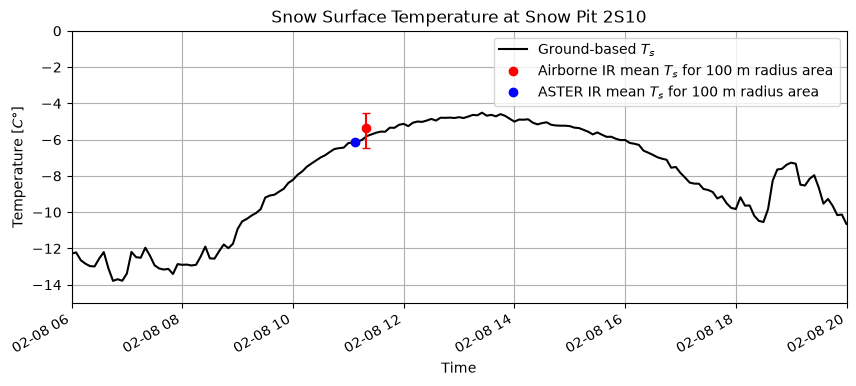
What is the difference between the “ground truth” data and the airborne IR data at this point in time?
Part 2: Satellite IR remote sensing obsevations
Satellite IR imagery with ASTER
Advantages of satellite IR images: We don’t always have airplanes with IR cameras flying around. Satellites can provide images at more regular intervals for long-term studies, and can see areas that are difficult to access on the ground or by air.
What might be some diadvantages of satellite IR imagery compared to airborne IR imagery?
Lower spatial resolution because they’re further away from the Earth’s surface
Mixed pixel problem: with lower image resolutions, each pixel contains a more heterogeneous mixtures of surfaces and temperatures, meaning that temperature information is more blurred together
What other disadvantages can you think of?
How might these differences (advantages or disadvantages) change the type of research questions you can investigate?
For this tutorial, we will look at an image from NASA’s Advanced Spaceborne Thermal Emission and Reflection Radiometer (ASTER) imager, which is onboard the Terra satellite along with a MODIS imager. We can compare an ASTER IR image of Grand Mesa that was taken at roughly the same time as the airborne IR image. The ASTER image we will be working with is from ASTER’s band 14 which is sensitive to radiance in the 10.95-11.65 µm wavelength range.
Load an ASTER geotiff that we’ve downloaded for this tutorial, and inspect its contents.
aster_ir = rioxarray.open_rasterio(S3_BASE_URL + 'AST_L1T_00302082020180748_20200209065849_17218_ImageData14.tif')Warning 1: HTTP response code on https://snowex-tutorials.s3.us-west-2.amazonaws.com/thermal-ir/AST_L1T_00302082020180748_20200209065849_17218_ImageData14.hdr: 403
Warning 1: HTTP response code on https://snowex-tutorials.s3.us-west-2.amazonaws.com/thermal-ir/AST_L1T_00302082020180748_20200209065849_17218_ImageData14.HDR: 403
Warning 1: HTTP response code on https://snowex-tutorials.s3.us-west-2.amazonaws.com/thermal-ir/AST_L1T_00302082020180748_20200209065849_17218_ImageData14.IMD: 403
Warning 1: HTTP response code on https://snowex-tutorials.s3.us-west-2.amazonaws.com/thermal-ir/AST_L1T_00302082020180748_20200209065849_17218_ImageData14.imd: 403
Warning 1: HTTP response code on https://snowex-tutorials.s3.us-west-2.amazonaws.com/thermal-ir/AST_L1T_00302082020180748_20200209065849_17218_ImageData14.RPB: 403
Warning 1: HTTP response code on https://snowex-tutorials.s3.us-west-2.amazonaws.com/thermal-ir/AST_L1T_00302082020180748_20200209065849_17218_ImageData14.rpb: 403
Warning 1: HTTP response code on https://snowex-tutorials.s3.us-west-2.amazonaws.com/thermal-ir/AST_L1T_00302082020180748_20200209065849_17218_ImageData14.PVL: 403
Warning 1: HTTP response code on https://snowex-tutorials.s3.us-west-2.amazonaws.com/thermal-ir/AST_L1T_00302082020180748_20200209065849_17218_ImageData14.pvl: 403
Warning 1: HTTP response code on https://snowex-tutorials.s3.us-west-2.amazonaws.com/thermal-ir/AST_L1T_00302082020180748_20200209065849_17218_ImageData14_rpc.txt: 403
Warning 1: HTTP response code on https://snowex-tutorials.s3.us-west-2.amazonaws.com/thermal-ir/AST_L1T_00302082020180748_20200209065849_17218_ImageData14_RPC.TXT: 403
Warning 1: HTTP response code on https://snowex-tutorials.s3.us-west-2.amazonaws.com/thermal-ir/AST_L1T_00302082020180748_20200209065849_17218_ImageData14_metadata.txt: 403
Warning 1: HTTP response code on https://snowex-tutorials.s3.us-west-2.amazonaws.com/thermal-ir/AST_L1T_00302082020180748_20200209065849_17218_ImageData14_METADATA.txt: 403
Warning 1: HTTP response code on https://snowex-tutorials.s3.us-west-2.amazonaws.com/thermal-ir/AST_L1T_00302082020180748_20200209065849_17218_ImageData14_MTL.txt: 403
Warning 1: HTTP response code on https://snowex-tutorials.s3.us-west-2.amazonaws.com/thermal-ir/AST_L1T_00302082020180748_20200209065849_17218_ImageData14_MTL.TXT: 403
Warning 1: HTTP response code on https://snowex-tutorials.s3.us-west-2.amazonaws.com/thermal-ir/AST_L1T_00302082020180748_20200209065849_17218_ImageData14_metadata.xml: 403
Warning 1: HTTP response code on https://snowex-tutorials.s3.us-west-2.amazonaws.com/thermal-ir/AST_L1T_00302082020180748_20200209065849_17218_ImageData14_METADATA.XML: 403
Warning 1: HTTP response code on https://snowex-tutorials.s3.us-west-2.amazonaws.com/thermal-ir/AST_L1T_00302082020180748_20200209065849_17218_ImageData14.TXT: 403
Warning 1: HTTP response code on https://snowex-tutorials.s3.us-west-2.amazonaws.com/thermal-ir/AST_L1T_00302082020180748_20200209065849_17218_ImageData14.txt: 403
Warning 1: HTTP response code on https://snowex-tutorials.s3.us-west-2.amazonaws.com/thermal-ir/AST_L1T_00302082020180748_20200209065849_17218_ImageData14.RPC: 403
Warning 1: HTTP response code on https://snowex-tutorials.s3.us-west-2.amazonaws.com/thermal-ir/AST_L1T_00302082020180748_20200209065849_17218_ImageData14.rpc: 403
Warning 1: HTTP response code on https://snowex-tutorials.s3.us-west-2.amazonaws.com/thermal-ir/HDRT_00302082020180748_20200209065849_17218_ImageData14.txt: 403
Warning 1: HTTP response code on https://snowex-tutorials.s3.us-west-2.amazonaws.com/thermal-ir/HDRT_00302082020180748_20200209065849_17218_ImageData14.TXT: 403
Warning 1: HTTP response code on https://snowex-tutorials.s3.us-west-2.amazonaws.com/thermal-ir/HDR_L1T_00302082020180748_20200209065849_17218_ImageData14.txt: 403
Warning 1: HTTP response code on https://snowex-tutorials.s3.us-west-2.amazonaws.com/thermal-ir/HDR_L1T_00302082020180748_20200209065849_17218_ImageData14.TXT: 403
Warning 1: HTTP response code on https://snowex-tutorials.s3.us-west-2.amazonaws.com/thermal-ir/RPCT_00302082020180748_20200209065849_17218_ImageData14.txt: 403
Warning 1: HTTP response code on https://snowex-tutorials.s3.us-west-2.amazonaws.com/thermal-ir/RPCT_00302082020180748_20200209065849_17218_ImageData14.TXT: 403
Warning 1: HTTP response code on https://snowex-tutorials.s3.us-west-2.amazonaws.com/thermal-ir/RPC_L1T_00302082020180748_20200209065849_17218_ImageData14.txt: 403
Warning 1: HTTP response code on https://snowex-tutorials.s3.us-west-2.amazonaws.com/thermal-ir/RPC_L1T_00302082020180748_20200209065849_17218_ImageData14.TXT: 403
Inspect the ASTER file we just opened
aster_irWhat is its CRS?
aster_ir.rio.crsCRS.from_wkt('PROJCS["WGS 84 / UTM zone 12N",GEOGCS["WGS 84",DATUM["WGS_1984",SPHEROID["WGS 84",6378137,298.257223563,AUTHORITY["EPSG","7030"]],AUTHORITY["EPSG","6326"]],PRIMEM["Greenwich",0,AUTHORITY["EPSG","8901"]],UNIT["degree",0.0174532925199433,AUTHORITY["EPSG","9122"]],AUTHORITY["EPSG","4326"]],PROJECTION["Transverse_Mercator"],PARAMETER["latitude_of_origin",0],PARAMETER["central_meridian",-111],PARAMETER["scale_factor",0.9996],PARAMETER["false_easting",500000],PARAMETER["false_northing",0],UNIT["metre",1,AUTHORITY["EPSG","9001"]],AXIS["Easting",EAST],AXIS["Northing",NORTH],AUTHORITY["EPSG","32612"]]')# Reproject this ASTER image into our common coordinate system
aster_ir = aster_ir.rio.reproject('EPSG:26912') # overwrite itself with new reprojected data arrayWarning 1: HTTP response code on https://snowex-tutorials.s3.us-west-2.amazonaws.com/thermal-ir/AST_L1T_00302082020180748_20200209065849_17218_ImageData14.tif.msk: 403
Warning 1: HTTP response code on https://snowex-tutorials.s3.us-west-2.amazonaws.com/thermal-ir/AST_L1T_00302082020180748_20200209065849_17218_ImageData14.tif.MSK: 403
When was this image taken?
aster_ir_timestamp = pd.Timestamp(2020,2,8,18,7,48) - pd.Timedelta(hours=7)/tmp/ipykernel_4399/2077060720.py:1: DeprecationWarning: The 'generic' unit for NumPy timedelta is deprecated, and will raise an error in the future. This includes implicit conversion of bare integers (e.g. `+ 1`). Please use a specific unit instead.
aster_ir_timestamp = pd.Timestamp(2020,2,8,18,7,48) - pd.Timedelta(hours=7)
Plot the image. What are the units of the values on the colorbar?
aster_ir.plot()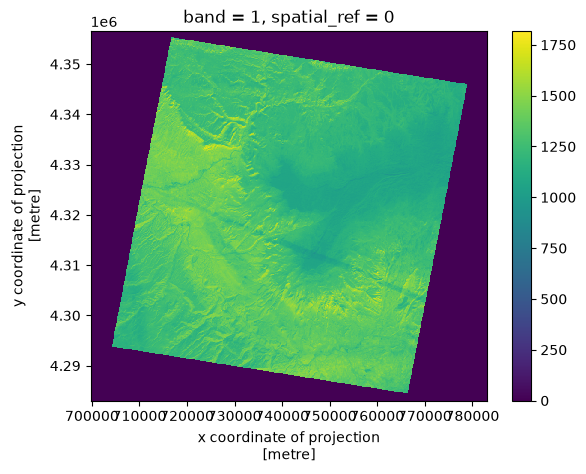
It’s necessary to read the product documentation to understand what we are looking at here.
We are using the ASTER Level 1 Precision Terrain Corrected Registered At-Sensor Radiance (AST_L1T) product. Product documentation is available here. Also helpful is the ** (AST_L1B) product documentation here from which AST_L1T is derived.
The values here are stored as scaled “digital number” (DN) values rather than the actual radiance values. The product documentation also provides information about how to unscale these values back into radiance units, and from radiance to brightness temperature, using laboratory calibrated constants.
I’ve written two functions here to do this unit conversion for the five ASTER TIR bands in two steps (DN to radiance, radiance to brightness temperature). The function takes as its arguments the DN or radiance values respectively, and the band number (in our case band number 14, not the band wavelengths).
def tir_dn2rad(DN, band):
    '''Convert AST_L1T Digital Number values to At-Sensor Radiance for the TIR bands (bands 10-14).'''
    ucc = [6.822e-3, 6.780e-3, 6.590e-3, 5.693e-3, 5.225e-3]
    rad = (DN-1.) * ucc[band-10]
    return rad

def tir_rad2tb(rad, band):
    '''Convert AST_L1T At-Sensor Radiance to Brightness Temperature [K] for the TIR bands (bands 10-14).'''
    k1 = [3047.47, 2480.93, 1930.80, 865.65, 649.60]
    k2 = [1736.18, 1666.21, 1584.72,1349.82, 1274.49]
    tb = k2[band-10] /  np.log((k1[band-10]/rad) + 1)
    return tb
Use the above functions to convert from DN to radiance, radiance to brightness temperature (assume and emissivity of 1 for all surfaces, note that the airborne imagery also assumed emissivity of 1).
Then convert from degeees K to degrees C by subtracting 273.15.
aster_band14_rad = tir_dn2rad( aster_ir, band=14 ) # convert from DN to radiance
aster_band14_tb_k = tir_rad2tb( aster_band14_rad, band=14 ) # convert from radiance to brightness temperature (K)
aster_band14_tb_c = aster_band14_tb_k - 273.15 # convert from K to C

# Note that an "invalid value encountered..." warning may pop up here. This is because the above function tries to take the log of "nan" values that are outside the imaged area
# we can ignore this warning and proceed
/home/runner/micromamba/envs/snow-observations-cookbook/lib/python3.14/site-packages/xarray/computation/apply_ufunc.py:820: RuntimeWarning: invalid value encountered in log
result_data = func(*input_data)
During this unit conversion, xarray dropped the coordinate reference system attributes, so here we add the original crs to the new ASTER degrees celsius dataarray.
aster_band14_tb_c.rio.set_crs(aster_ir.rio.crs, inplace=True);/tmp/ipykernel_4399/3871339668.py:1: FutureWarning: It is recommended to use 'rio.write_crs()' instead. 'rio.set_crs()' will likelybe removed in a future release.
aster_band14_tb_c.rio.set_crs(aster_ir.rio.crs, inplace=True);
Plot our image again, this time setting our colorscale and colorbar values. We should see “realistic” surface temperature values in degrees C now.
fig, ax = plt.subplots(figsize=(15,10))
ax.set_aspect('equal')
aster_band14_tb_c.plot(ax=ax,
                       cmap='magma',
                       vmin=-20, vmax=20, # note that we have a wider temperature range on our colorbar for this image, -20 to +20 C instead of -10 to +10 C
                       cbar_kwargs={'label': r'Temperature $\degree C$'})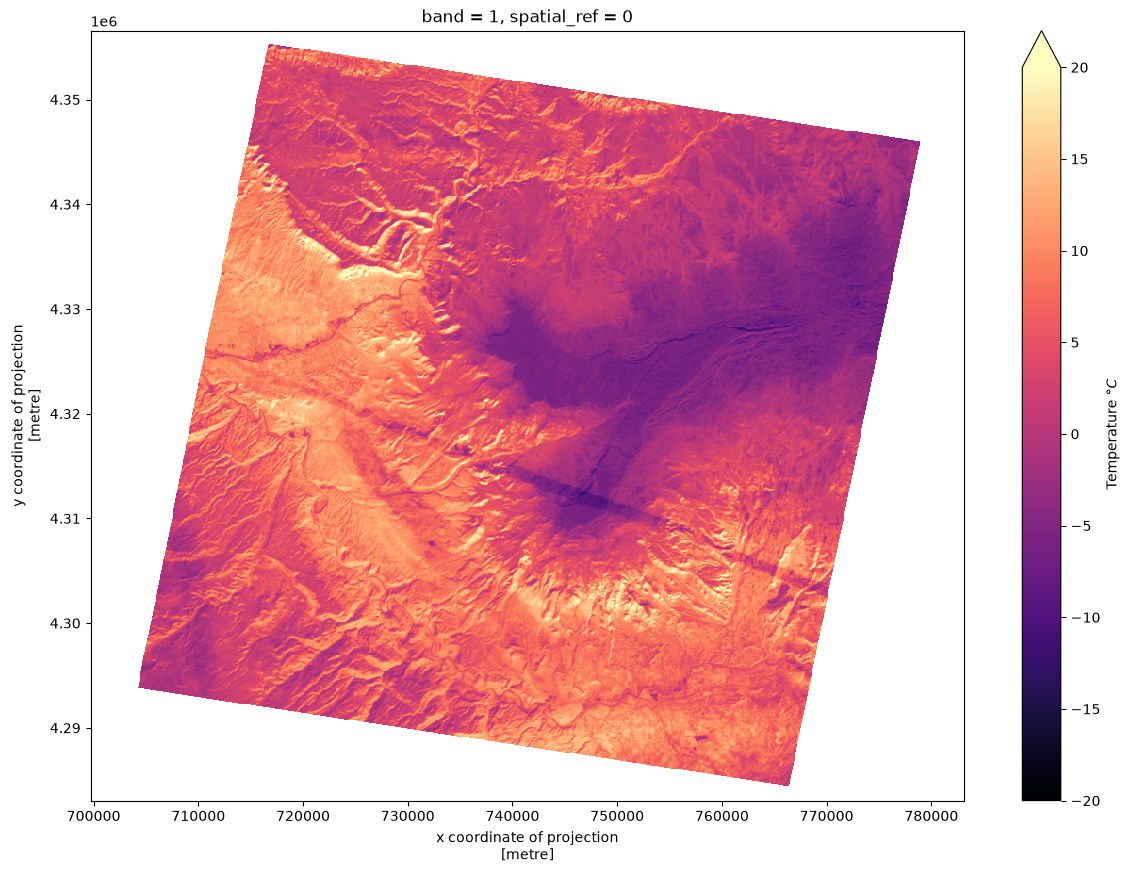
Plot ASTER next to Airborne IR to see spatial resolution differences
fig, axs = plt.subplots(nrows=2, ncols=1, figsize=(12,6), tight_layout=True)

aster_band14_tb_c.plot(ax=axs[0],
                       cmap='magma',
                       vmin=-10, vmax=10,
                       cbar_kwargs={'label': r'Temperature $\degree C$'})
axs[0].set_title('ASTER IR')
axs[0].set_aspect('equal')


airborne_ir.plot(ax=axs[1],
                 cmap='magma',
                 vmin=-10, vmax=10,
                 cbar_kwargs={'label': r'Temperature $\degree C$'})
axs[1].set_title('Airborne IR')
axs[1].set_aspect('equal')

# for each subplot, do the following:
for ax in axs:
    ax.set_aspect('equal') # set the aspect ratio to "equal"

    # plot the location of the snow pit of interest
    siteData_df.plot(ax=ax, color='r', marker='x')
    # plot the area of the buffer we made around the snow pit
    siteData_df_buffer.plot(ax=ax, edgecolor='r', facecolor='none')

    # set axes labels and limits
    ax.set_xlabel('Eastings UTM 12N (m)')
    ax.set_xlim((735000, 760000))
    ax.set_ylabel('Northings UTM 12N (m)')
    ax.set_ylim((4320000, 4325000))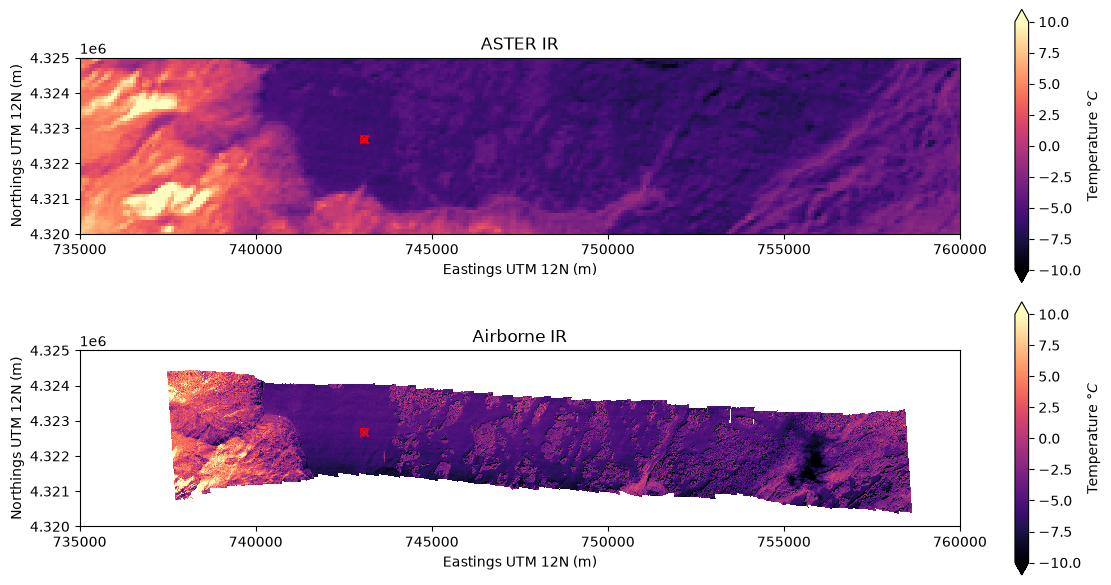
Make another plot to zoom in on snow pit 2S10:
fig, axs = plt.subplots(nrows=1, ncols=2, figsize=(12,4), tight_layout=True)

aster_band14_tb_c.plot(ax=axs[0],
                       cmap='magma',
                       vmin=-10, vmax=10,
                       cbar_kwargs={'label': r'Temperature $\degree C$'})
axs[0].set_title('ASTER IR')
axs[0].set_aspect('equal')


airborne_ir.plot(ax=axs[1],
                 cmap='magma',
                 vmin=-10, vmax=10,
                 cbar_kwargs={'label': r'Temperature $\degree C$'})
axs[1].set_title('Airborne IR')
axs[1].set_aspect('equal')

# for each subplot, do the following:
for ax in axs:
    ax.set_aspect('equal') # set the aspect ratio to "equal"

    # plot the location of the snow pit of interest
    siteData_df.plot(ax=ax, color='r', marker='x')
    # plot the area of the buffer we made around the snow pit
    siteData_df_buffer.plot(ax=ax, edgecolor='r', facecolor='none')

    # set axes labels
    ax.set_xlabel('Eastings UTM 12N (m)')
    ax.set_ylabel('Northings UTM 12N (m)')
    # set the same axes limits as above
    ax.set_xlim((xmin-1000, xmax+1000)) # x axis limits to +/- 1 km from our point's "total bounds"
    ax.set_ylim((ymin-1000, ymax+1000)) # y axis limits to +/- 1 km from our point's "total bounds"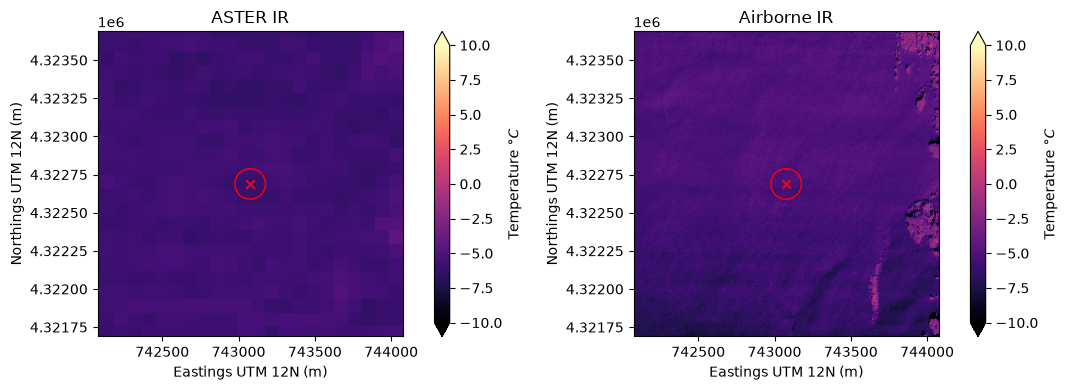
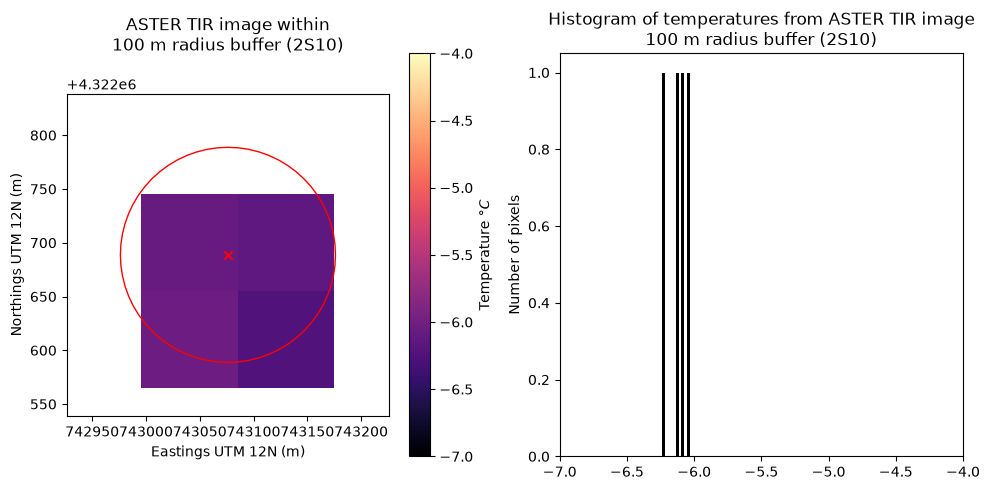
Get the temperature of the ASTER pixel at the snow pit point using rioxarray clip.
# First clip to the single point
aster_band14_tb_c_point_temperature = aster_band14_tb_c.rio.clip(siteData_df.geometry)

# Second clip to the 100 m radius buffered area
aster_band14_tb_c_area_temperature = aster_band14_tb_c.rio.clip(siteData_df_buffer.geometry)

# preview the result
aster_band14_tb_c_area_temperatureHow many ASTER pixels in the area did we select?
Plot the clipped area:
fig, ax = plt.subplots(nrows=1, ncols=2, figsize=(10,5), tight_layout=True)

# plot the portion of the airborne TIR image we selected within the buffer area geometry
aster_band14_tb_c_area_temperature.plot(cmap='magma', vmin=-7, vmax=-4, ax=ax[0],
                 cbar_kwargs={'label': 'Temperature $\degree C$'})
ax[0].set_title('ASTER TIR image within\n100 m radius buffer (2S10)\n')
ax[0].set_aspect('equal')
ax[0].set_xlabel('Eastings UTM 12N (m)')
ax[0].set_ylabel('Northings UTM 12N (m)')
ax[0].set_xlim((xmin-150, xmax+150)) # x axis limits to +/- 150 m from our point's "total bounds"
ax[0].set_ylim((ymin-150, ymax+150)) # y axis limits to +/- 150 m from our point's "total bounds"

# plot the location of the snow pit of interest to the plot
siteData_df.plot(ax=ax[0], color='r', marker='x')

# plot the area of the buffer we made around the snow pit
siteData_df_buffer.plot(ax=ax[0], edgecolor='r', facecolor='none')

# plot a histogram of image temperature data within the buffer area geometry
aster_band14_tb_c_area_temperature.plot.hist(ax=ax[1], color='k');
ax[1].set_xlim((-7,-4)) # set xlim to same values as colorbar in image plot
ax[1].set_title('Histogram of temperatures from ASTER TIR image\n100 m radius buffer (2S10)')
ax[1].set_ylabel('Number of pixels');
<>:5: SyntaxWarning: "\d" is an invalid escape sequence. Such sequences will not work in the future. Did you mean "\\d"? A raw string is also an option.
<>:5: SyntaxWarning: "\d" is an invalid escape sequence. Such sequences will not work in the future. Did you mean "\\d"? A raw string is also an option.
/tmp/ipykernel_4399/3974720511.py:5: SyntaxWarning: "\d" is an invalid escape sequence. Such sequences will not work in the future. Did you mean "\\d"? A raw string is also an option.
cbar_kwargs={'label': 'Temperature $\degree C$'})
Plot the ASTER IR temperature data on top of the ground-based timeseries and airborne IR temperature
plt.figure(figsize=(10,4))

# plot radiometer average temperature
df.rad_avg.plot(linestyle='-', marker='', markersize=1, c='k', label='Ground-based $T_s$')

# plot the mean airborne IR temperature from the area around the snow pit:
plt.plot(airborne_ir_timestamp, airborne_ir_area_temperature.mean(),
         marker='o', c='r', linestyle='none',
         label='Airborne IR mean $T_s$ for 100 m radius area')
# plot an error bar showing the maximum and minimum airborne IR temperature around the snow pit
plt.errorbar(airborne_ir_timestamp, airborne_ir_area_temperature.mean(),
             yerr=[[airborne_ir_area_temperature.mean()-airborne_ir_area_temperature.min()],
                   [airborne_ir_area_temperature.max()-airborne_ir_area_temperature.mean()]],
            capsize=3, fmt='none', ecolor='r',
            )#label='Airborne IR $T_s$ range for 100 m radius area')

# plot the mean ASTER IR temperature from the area around the snow pit:
plt.plot(aster_ir_timestamp, aster_band14_tb_c_area_temperature.mean(),
         marker='o', c='b', linestyle='none',
        label='ASTER IR mean $T_s$ for 100 m radius area')
# plot an error bar showing the maximum and minimum ASTER IR temperature around the snow pit
plt.errorbar(aster_ir_timestamp, aster_band14_tb_c_area_temperature.mean(),
             yerr=[[aster_band14_tb_c_area_temperature.mean()-aster_band14_tb_c_area_temperature.min()],
                   [aster_band14_tb_c_area_temperature.max()-aster_band14_tb_c_area_temperature.mean()]],
            capsize=3, fmt='none', ecolor='b',
            )#label='ASTER IR $T_s$ range for 100 m radius area')


# set axes limits
plt.ylim((-15,0))
plt.xlim((pd.Timestamp(2020,2,8,6,0),pd.Timestamp(2020,2,8,20,0))) # zoom in to daytime hours on Feb. 8, 2020

# add a legend to the plot
plt.legend()

# set axes labels
plt.ylabel('Temperature [$C\degree$]')
plt.xlabel('Time')

# add grid lines to the plot
plt.grid('on')

# set the plot title
plt.title('Snow Surface Temperature at Snow Pit 2S10');
<>:37: SyntaxWarning: "\d" is an invalid escape sequence. Such sequences will not work in the future. Did you mean "\\d"? A raw string is also an option.
<>:37: SyntaxWarning: "\d" is an invalid escape sequence. Such sequences will not work in the future. Did you mean "\\d"? A raw string is also an option.
/tmp/ipykernel_4399/4068806060.py:37: SyntaxWarning: "\d" is an invalid escape sequence. Such sequences will not work in the future. Did you mean "\\d"? A raw string is also an option.
plt.ylabel('Temperature [$C\degree$]')
/tmp/ipykernel_4399/4068806060.py:7: UserWarning: This axis already has a converter set and is updating to a potentially incompatible converter
plt.plot(airborne_ir_timestamp, airborne_ir_area_temperature.mean(),
Bonus activity: comparing two thermal IR rasters
How does the finer spatial resolution airborne IR image compare with the coarser resolution ASTER IR image?
One way to compare these two images is to “upscale” the finer resolution airborne IR image to the same spatial resolution as ASTER.
We can use the rioxarray reproject_match function to do this. (also see this example)
Note that this function has multiple options for how we want to resample the image data to the new spatial resolution. We will use resampling=5 which corresponds to taking the mean value.
airborne_ir_repr = airborne_ir.rio.reproject_match(aster_ir, resampling=5)Preview the result.
What are the image dimensions of the reprojected airborne IR image compared with the original?
airborne_ir_reprPlot the ASTER image, original airborne IR image, and resampled airborne IR image next to each other to visualize these spatial resolution differences.
fig, axs = plt.subplots(nrows=1, ncols=3, figsize=(15,4), tight_layout=True)

# ASTER IR image
aster_band14_tb_c.plot(ax=axs[0],
                       cmap='magma',
                       vmin=-10, vmax=10,
                       cbar_kwargs={'label': r'Temperature $\degree C$'})
axs[0].set_title('ASTER IR')
axs[0].set_aspect('equal')

# Original airborne IR image
airborne_ir.plot(ax=axs[1],
                 cmap='magma',
                 vmin=-10, vmax=10,
                 cbar_kwargs={'label': r'Temperature $\degree C$'})
axs[1].set_title('Airborne IR')
axs[1].set_aspect('equal')

# Resampled airborne IR image
airborne_ir_repr.plot(ax=axs[2],
                      cmap='magma',
                      vmin=-10, vmax=10,
                      cbar_kwargs={'label': r'Temperature $\degree C$'})
axs[2].set_title('Airborne IR resampled (mean)\nto ASTER resolution (90m)')
axs[2].set_aspect('equal')


# for each subplot, do the following:
for ax in axs:
    ax.set_aspect('equal') # set the aspect ratio to "equal"

    # plot the location of the snow pit of interest
    siteData_df.plot(ax=ax, color='r', marker='x')
    # plot the area of the buffer we made around the snow pit
    siteData_df_buffer.plot(ax=ax, edgecolor='r', facecolor='none')

    # set axes labels
    ax.set_xlabel('Eastings UTM 12N (m)')
    ax.set_ylabel('Northings UTM 12N (m)')
    # set the same axes limits as above
    ax.set_xlim((xmin-1000, xmax+1000)) # x axis limits to +/- 1 km from our point's "total bounds"
    ax.set_ylim((ymin-1000, ymax+1000)) # y axis limits to +/- 1 km from our point's "total bounds"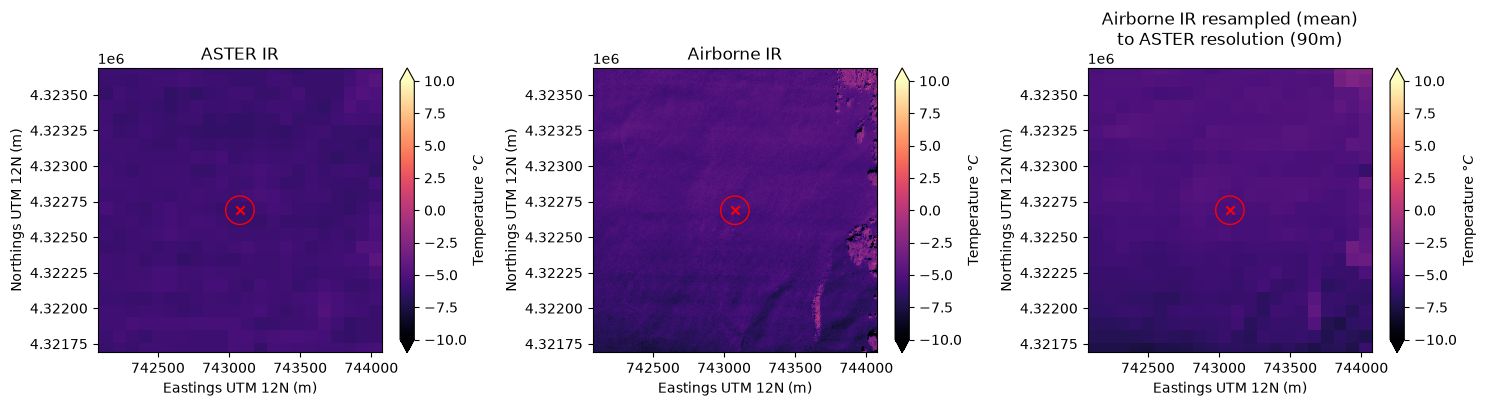
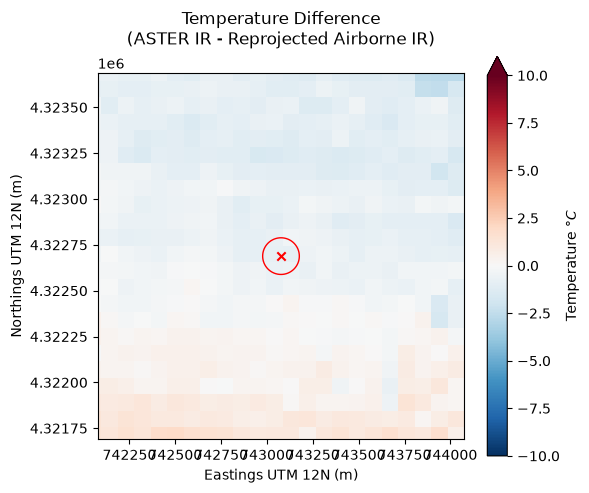
Finally, compute the difference between the ASTER IR image and resampled airborne IR image, then plot the result:
# Subtract reprojected airborne IR image from ASTER IR image
difference_image = aster_band14_tb_c - airborne_ir_repr
fig, ax = plt.subplots(nrows=1, ncols=1, figsize=(6,5), tight_layout=True)
# Difference image
difference_image.plot(ax=ax,
cmap='RdBu_r',
vmin=-10, vmax=10,
cbar_kwargs={'label': 'Temperature $\degree C$'})
ax.set_title('Temperature Difference\n(ASTER IR - Reprojected Airborne IR)\n')
ax.set_aspect('equal')
# plot the location of the snow pit of interest
siteData_df.plot(ax=ax, color='r', marker='x')
# plot the area of the buffer we made around the snow pit
siteData_df_buffer.plot(ax=ax, edgecolor='r', facecolor='none')
# set axes labels
ax.set_xlabel('Eastings UTM 12N (m)')
ax.set_ylabel('Northings UTM 12N (m)')
# set the same axes limits as above
ax.set_xlim((xmin-1000, xmax+1000)) # x axis limits to +/- 1 km from our point's "total bounds"
ax.set_ylim((ymin-1000, ymax+1000)); # y axis limits to +/- 1 km from our point's "total bounds"<>:7: SyntaxWarning: "\d" is an invalid escape sequence. Such sequences will not work in the future. Did you mean "\\d"? A raw string is also an option.
<>:7: SyntaxWarning: "\d" is an invalid escape sequence. Such sequences will not work in the future. Did you mean "\\d"? A raw string is also an option.
/tmp/ipykernel_4399/1907299178.py:7: SyntaxWarning: "\d" is an invalid escape sequence. Such sequences will not work in the future. Did you mean "\\d"? A raw string is also an option.
cbar_kwargs={'label': 'Temperature $\degree C$'})
Next steps:
Project ideas with these data:
Compare more snow pit temperature data (using snowexsql queries) against airborne and satellite IR imagery
Investigate spatial patterns of snow temperature from open areas to forested areas on the mesa, differences between ASTER and airborne IR imagery
Improved data visualization using hvplot or something similar to create interactive plots of IR and/or visible imagery
Compare thermal infrared and SAR imagery, or snow temperature observations and snow model outputs
Additional learning resources:
Open an airborne TIR mosaic NetCDF file
# Open airborne TIR mosaic NetCDF file
with fsspec.open(S3_BASE_URL + 'SNOWEX2020_IR_PLANE_2020Feb08_mosaicked_APLUW.nc') as f:
    ds = xr.open_dataset(f, decode_times=False)
    ds = ds.load()
Inspect the dataset and its dimensions
# Preview the dataset
ds# Take a look at the dimensions in the dataset
ds.dimsFrozenMappingWarningOnValuesAccess({'pass': 17, 'easting, x': 4171, 'northing, y': 3581, 'na': 1})There is an extra dimension (“na”) that we will want to drop, we will want to rename some of the dims, assign coordinates to those dims, and add a coordinate reference system for plotting.
# Drop the extra "na" dimension from E_UTM, N_UTM, and time
ds['E_UTM'] = ds['E_UTM'].isel(na=0, drop=True)
ds['N_UTM'] = ds['N_UTM'].isel(na=0, drop=True)
ds['time'] = ds['time'].isel(na=0, drop=True)
Rename the dimensions to some easier to use names
# Rename dims
ds = ds.rename({"pass" : "time",
                "easting, x" : "easting",
                "northing, y" : "northing"})
This NetCDF file was generated in MATLAB, and the dates/times are in an epoch format. Use utcfromtimestamp() and isoformat() to convert and reformat into a more convenient format.
# Decode matlab (epoch) format times
utctime = [datetime.utcfromtimestamp(this_time).isoformat() for this_time in ds.time.values]
/tmp/ipykernel_4399/3153572546.py:2: DeprecationWarning: datetime.datetime.utcfromtimestamp() is deprecated and scheduled for removal in a future version. Use timezone-aware objects to represent datetimes in UTC: datetime.datetime.fromtimestamp(timestamp, datetime.UTC).
utctime = [datetime.utcfromtimestamp(this_time).isoformat() for this_time in ds.time.values]
Assign and then transpose coordinates in our dataset
# Assign coordinates to the "northing",  "easting", and "time" dimensions
ds = ds.assign_coords({"time": utctime, "northing": ds.N_UTM, "easting": ds.E_UTM})
# Transpose coords
ds = ds.transpose("time", "northing", "easting")Set spatial dimensions then define which coordinate reference system the spatial dimensions are in
# Write the coordinate reference system for the spatial dims with rioxarray
# https://github.com/corteva/rioxarray/issues/379
ds.rio.write_crs('epsg:32612', inplace=True,
                ).rio.set_spatial_dims('easting', 'northing', inplace=True,
).rio.write_coordinate_system(inplace=True)- Lundquist, J. D., Chickadel, C., Cristea, N., Currier, W. R., Henn, B., Keenan, E., & Dozier, J. (2018). Separating snow and forest temperatures with thermal infrared remote sensing. Remote Sensing of Environment, 209, 764–779. 10.1016/j.rse.2018.03.001