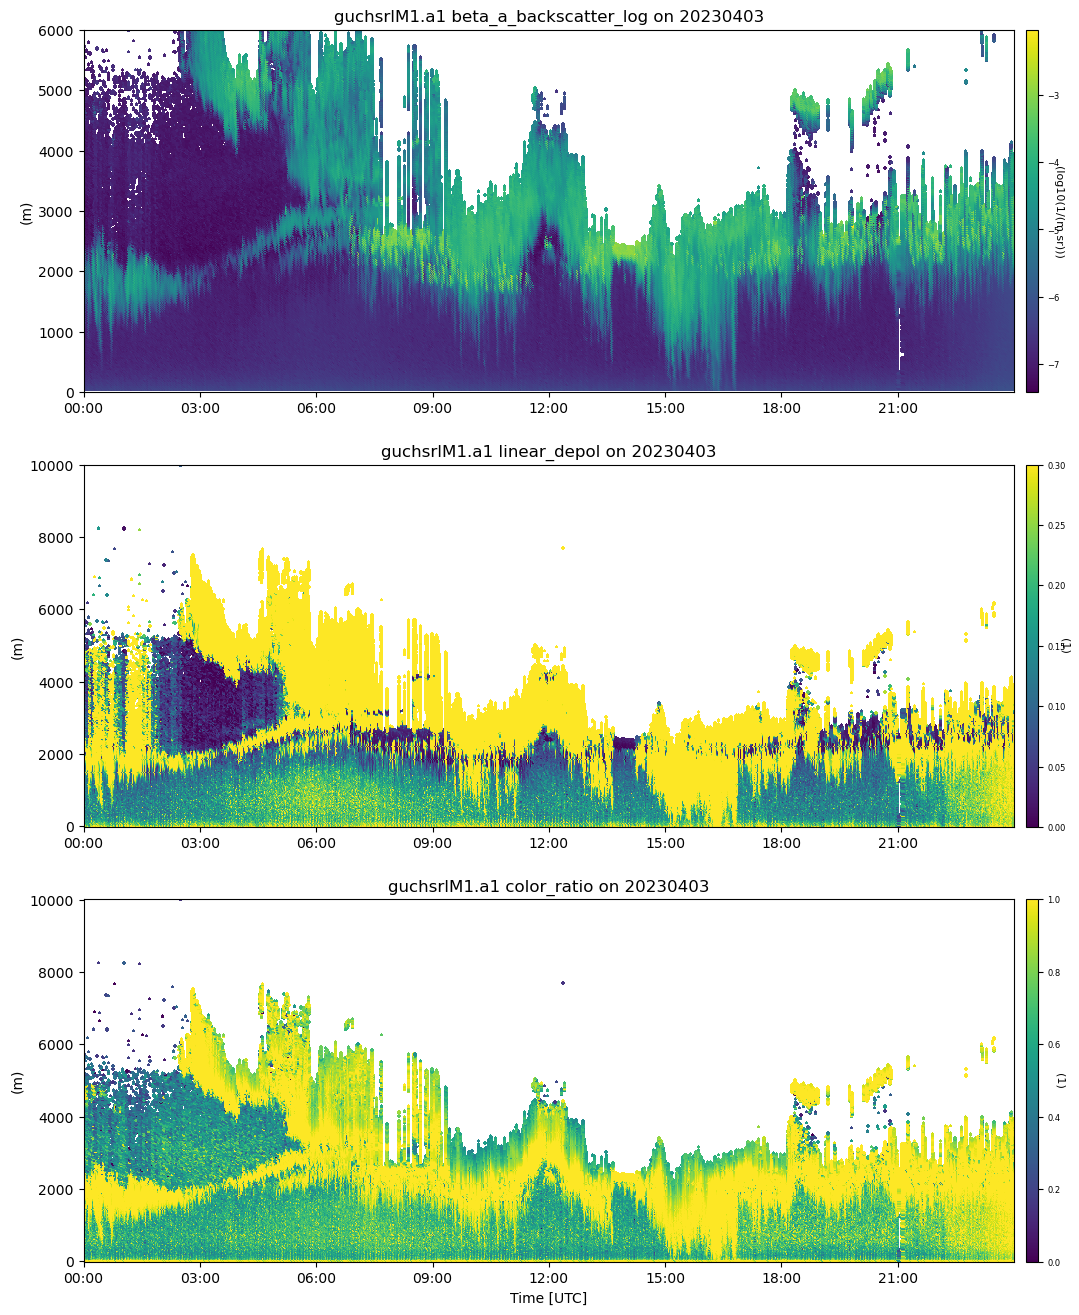
# analysis of high aerosol loading during dust event (April 3, 2024)
# read High Spectra Resolution Lidar (HSRL) data using ACT

### code courtesy of Damao Zhang ###

#%matplotlib widget
import ipywidgets as widgets

import matplotlib.pyplot as plt
import ipywidgets as widgets
import numpy as np
import pandas as pd
import os
from datetime import datetime

import act
import xarray as xr
Dust layer observations
### April 3rd, 2022 ###
# Set your username and token here!
username = 'username'
token = 'token'
# Set the datastream and start/enddates
datastream = 'guchsrlM1.a1'
startdate = '2023-04-3'
enddate = '2023-04-3'
# Use ACT to easily download the data. Watch for the data citation! Show some support
# for ARM's instrument experts and cite their data if you use it in a publication
result = act.discovery.download_arm_data(username, token, datastream, startdate, enddate)
result.sort()
ds = act.io.read_arm_netcdf(result)
ds.clean.cleanup()
# compute log of backscatter
ds['beta_a_backscatter_log'] = np.log10(ds['beta_a_backscatter'])
ds['beta_a_backscatter_log'].attrs['units'] = f"log10({ds['beta_a_backscatter'].attrs['units']})"
ds = ds.where(ds.range <= 10000, drop=True)
mask = ds['particulate_backscatter_signal_to_noise']>=3
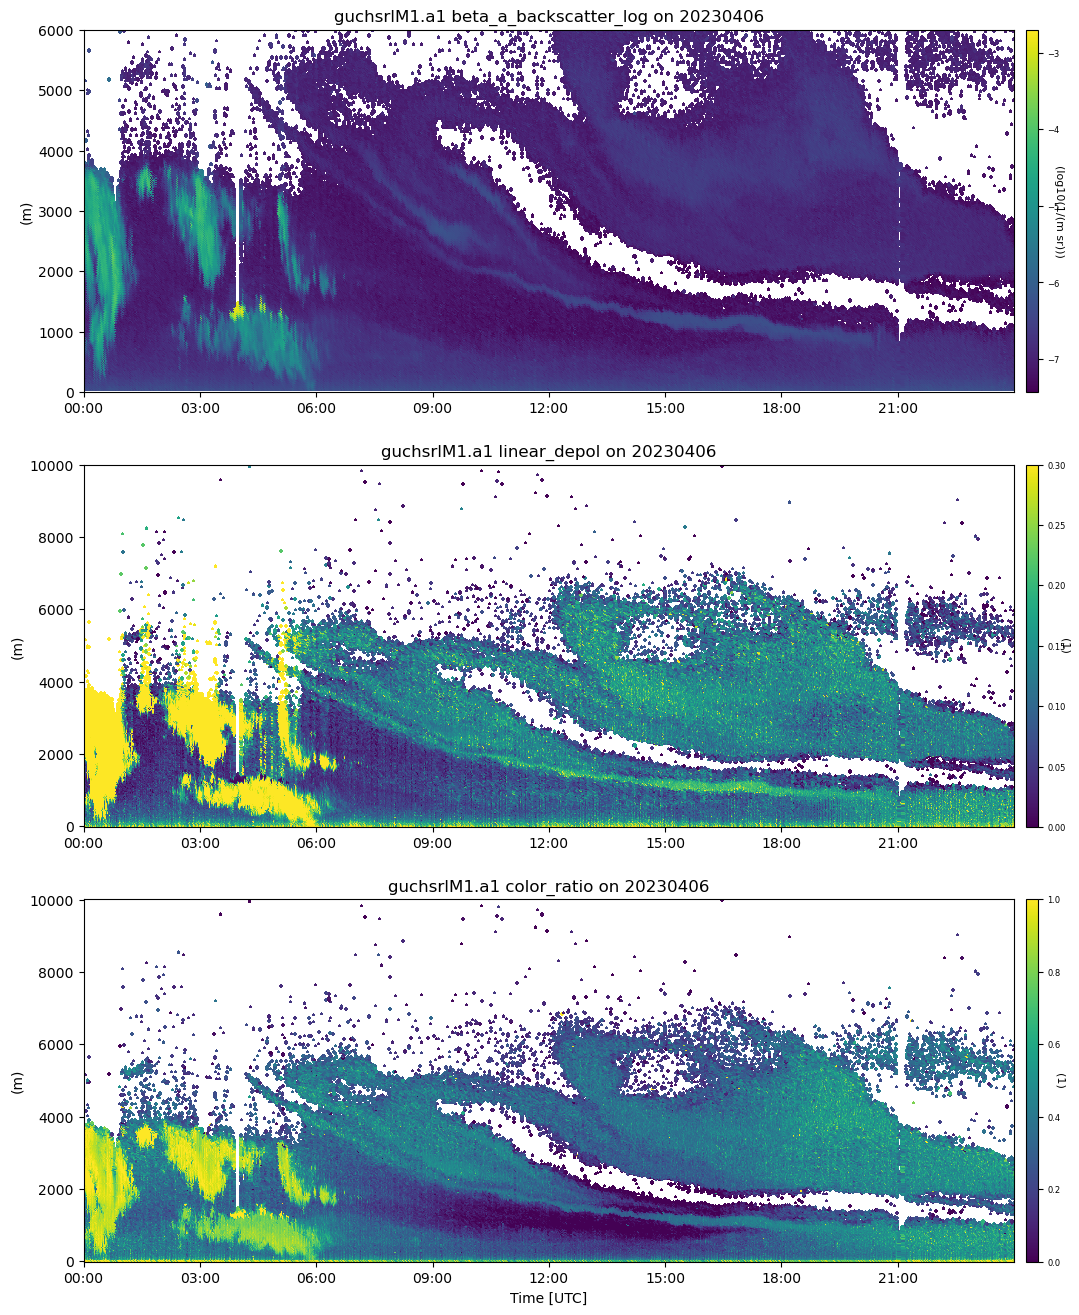
#beta_a_backscatter - column backscatter
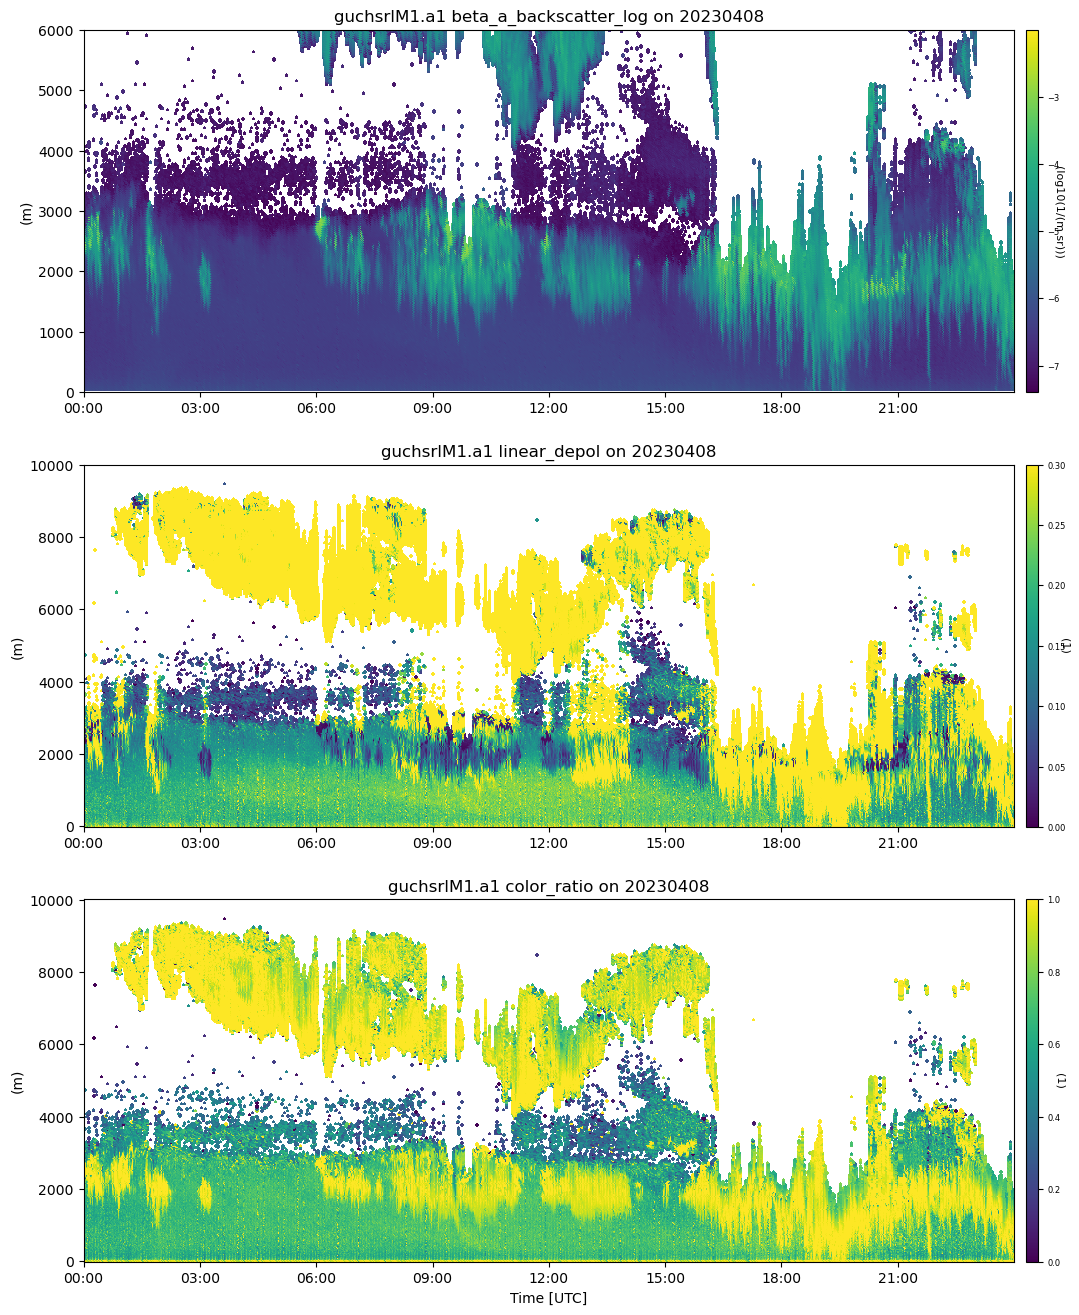
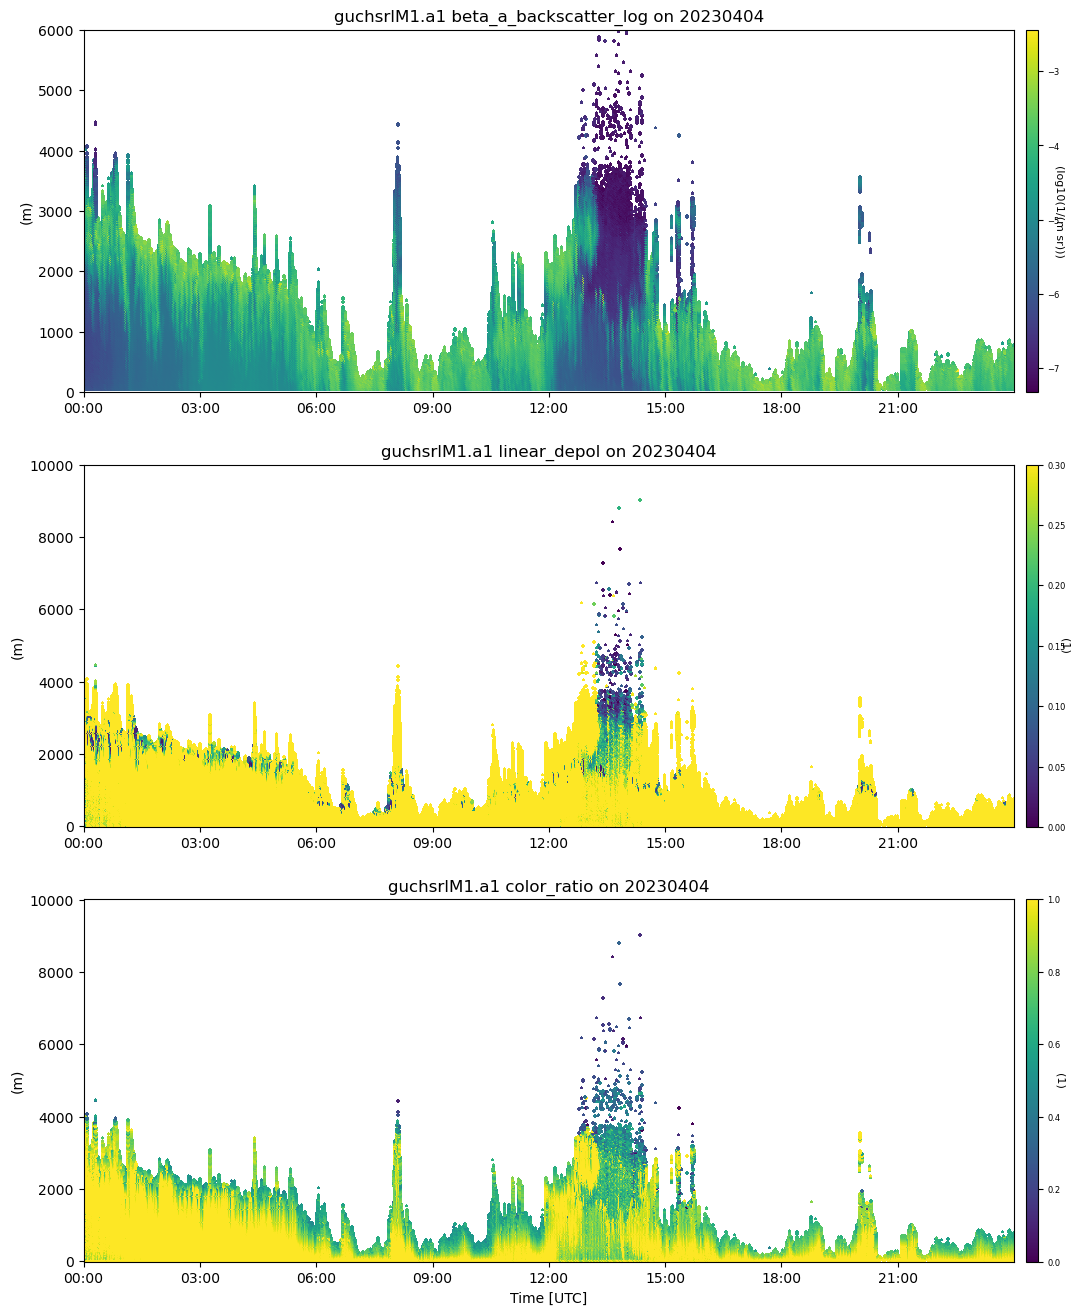
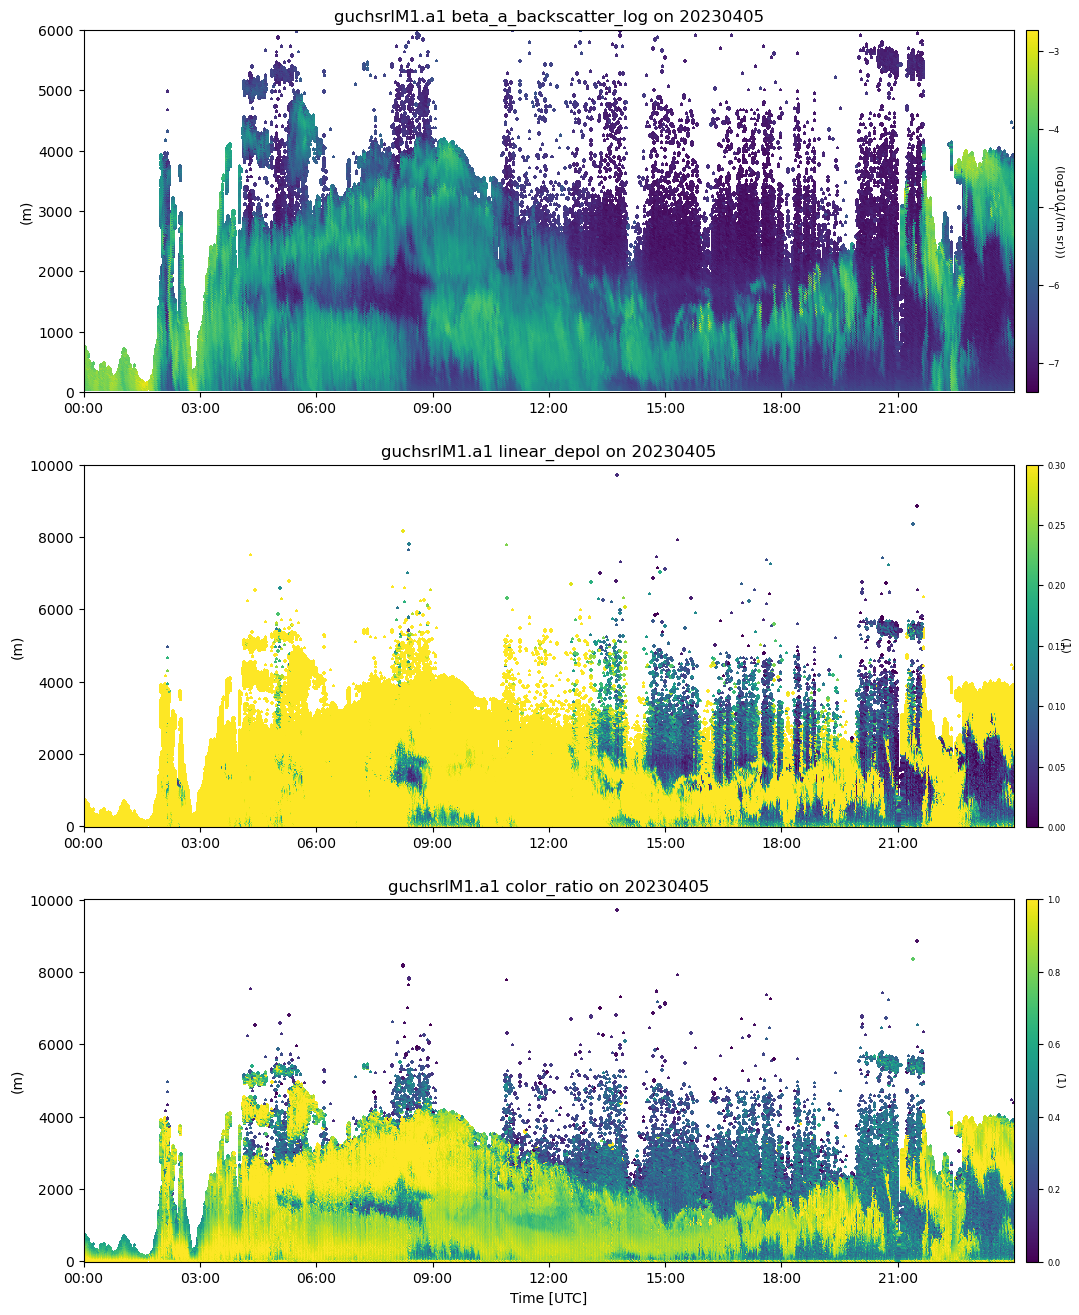
variables = ['beta_a_backscatter_log', 'linear_depol', 'color_ratio']
# watch out cloudy pixels
display = act.plotting.TimeSeriesDisplay(ds.where(mask),
subplot_shape=(3,), figsize=(12,16))
display.plot(variables[0], subplot_index=(0,))
display.set_yrng([0, 6000], subplot_index=(0,))
# linear_depol indicates irregular aerosol
display.plot(variables[1], subplot_index=(1,), vmin = 0, vmax = 0.3)
display.set_yrng([0, 6000], subplot_index=(0,))
# color_ratio an indicator of aerosol particle size. Large aerosol particles have larger color_ratios
display.plot(variables[2], subplot_index=(2,), vmin = 0, vmax = 1)
display.set_yrng([0, 6000], subplot_index=(0,))
plt.show()
[DOWNLOADING] guchsrlM1.a1.20230403.000000.nc

If you use these data to prepare a publication, please cite:

Holz, R., Garcia, J., Schuman, E., Bambha, R., Ermold, B., Eloranta, E., &
Garcia, J. High Spectral Resolution Lidar (HSRL). Atmospheric Radiation
Measurement (ARM) User Facility. https://doi.org/10.5439/1462207
/opt/conda/lib/python3.11/site-packages/dask/core.py:127: RuntimeWarning: invalid value encountered in log10
  return func(*(_execute_task(a, cache) for a in args))
### April 4rd, 2022 ###
# Set your username and token here!
username = 'username'
token = 'token'

# Set the datastream and start/enddates

datastream = 'guchsrlM1.a1'
startdate = '2023-04-4'
enddate = '2023-04-4'

# Use ACT to easily download the data.  Watch for the data citation!  Show some support
# for ARM's instrument experts and cite their data if you use it in a publication
result = act.discovery.download_arm_data(username, token, datastream, startdate, enddate)
result.sort()

ds = act.io.read_arm_netcdf(result)
ds.clean.cleanup()

# compute log of backscatter
ds['beta_a_backscatter_log'] = np.log10(ds['beta_a_backscatter'])
ds['beta_a_backscatter_log'].attrs['units'] = f"log10({ds['beta_a_backscatter'].attrs['units']})"
ds = ds.where(ds.range <= 10000, drop=True)

mask = ds['particulate_backscatter_signal_to_noise']>=3

#beta_a_backscatter - column backscatter
variables = ['beta_a_backscatter_log', 'linear_depol', 'color_ratio']

# watch out cloudy pixels
display = act.plotting.TimeSeriesDisplay(ds.where(mask),
                                         subplot_shape=(3,), figsize=(12,16))
display.plot(variables[0], subplot_index=(0,))
display.set_yrng([0, 6000], subplot_index=(0,))

# linear_depol indicates irregular aerosol
display.plot(variables[1], subplot_index=(1,), vmin = 0, vmax = 0.3)
display.set_yrng([0, 6000], subplot_index=(0,))

# color_ratio an indicator of aerosol particle size. Large aerosol particles have larger color_ratios
display.plot(variables[2], subplot_index=(2,), vmin = 0, vmax = 1)
display.set_yrng([0, 6000], subplot_index=(0,))

plt.show()
[DOWNLOADING] guchsrlM1.a1.20230404.000000.nc

If you use these data to prepare a publication, please cite:

Holz, R., Garcia, J., Schuman, E., Bambha, R., Ermold, B., Eloranta, E., &
Garcia, J. High Spectral Resolution Lidar (HSRL). Atmospheric Radiation
Measurement (ARM) User Facility. https://doi.org/10.5439/1462207
/opt/conda/lib/python3.11/site-packages/dask/core.py:127: RuntimeWarning: invalid value encountered in log10
  return func(*(_execute_task(a, cache) for a in args))
### April 5rd, 2022 ###
# Set your username and token here!
username = 'username'
token = 'token'

# Set the datastream and start/enddates

datastream = 'guchsrlM1.a1'
startdate = '2023-04-5'
enddate = '2023-04-5'

# Use ACT to easily download the data.  Watch for the data citation!  Show some support
# for ARM's instrument experts and cite their data if you use it in a publication
result = act.discovery.download_arm_data(username, token, datastream, startdate, enddate)
result.sort()

ds = act.io.read_arm_netcdf(result)
ds.clean.cleanup()

# compute log of backscatter
ds['beta_a_backscatter_log'] = np.log10(ds['beta_a_backscatter'])
ds['beta_a_backscatter_log'].attrs['units'] = f"log10({ds['beta_a_backscatter'].attrs['units']})"
ds = ds.where(ds.range <= 10000, drop=True)

mask = ds['particulate_backscatter_signal_to_noise']>=3

#beta_a_backscatter - column backscatter
variables = ['beta_a_backscatter_log', 'linear_depol', 'color_ratio']

# watch out cloudy pixels
display = act.plotting.TimeSeriesDisplay(ds.where(mask),
                                         subplot_shape=(3,), figsize=(12,16))
display.plot(variables[0], subplot_index=(0,))
display.set_yrng([0, 6000], subplot_index=(0,))

# linear_depol indicates irregular aerosol
display.plot(variables[1], subplot_index=(1,), vmin = 0, vmax = 0.3)
display.set_yrng([0, 6000], subplot_index=(0,))

# color_ratio an indicator of aerosol particle size. Large aerosol particles have larger color_ratios
display.plot(variables[2], subplot_index=(2,), vmin = 0, vmax = 1)
display.set_yrng([0, 6000], subplot_index=(0,))

plt.show()
[DOWNLOADING] guchsrlM1.a1.20230405.000000.nc

If you use these data to prepare a publication, please cite:

Holz, R., Garcia, J., Schuman, E., Bambha, R., Ermold, B., Eloranta, E., &
Garcia, J. High Spectral Resolution Lidar (HSRL). Atmospheric Radiation
Measurement (ARM) User Facility. https://doi.org/10.5439/1462207
/opt/conda/lib/python3.11/site-packages/dask/core.py:127: RuntimeWarning: invalid value encountered in log10
  return func(*(_execute_task(a, cache) for a in args))
### April 6rd, 2022 ###
# Set your username and token here!
username = 'username'
token = 'token'

# Set the datastream and start/enddates

datastream = 'guchsrlM1.a1'
startdate = '2023-04-6'
enddate = '2023-04-6'

# Use ACT to easily download the data.  Watch for the data citation!  Show some support
# for ARM's instrument experts and cite their data if you use it in a publication
result = act.discovery.download_arm_data(username, token, datastream, startdate, enddate)
result.sort()

ds = act.io.read_arm_netcdf(result)
ds.clean.cleanup()

# compute log of backscatter
ds['beta_a_backscatter_log'] = np.log10(ds['beta_a_backscatter'])
ds['beta_a_backscatter_log'].attrs['units'] = f"log10({ds['beta_a_backscatter'].attrs['units']})"
ds = ds.where(ds.range <= 10000, drop=True)

mask = ds['particulate_backscatter_signal_to_noise']>=3

#beta_a_backscatter - column backscatter
variables = ['beta_a_backscatter_log', 'linear_depol', 'color_ratio']

# watch out cloudy pixels
display = act.plotting.TimeSeriesDisplay(ds.where(mask),
                                         subplot_shape=(3,), figsize=(12,16))
display.plot(variables[0], subplot_index=(0,))
display.set_yrng([0, 6000], subplot_index=(0,))

# linear_depol indicates irregular aerosol
display.plot(variables[1], subplot_index=(1,), vmin = 0, vmax = 0.3)
display.set_yrng([0, 6000], subplot_index=(0,))

# color_ratio an indicator of aerosol particle size. Large aerosol particles have larger color_ratios
display.plot(variables[2], subplot_index=(2,), vmin = 0, vmax = 1)
display.set_yrng([0, 6000], subplot_index=(0,))

plt.show()
[DOWNLOADING] guchsrlM1.a1.20230406.000000.nc

If you use these data to prepare a publication, please cite:

Holz, R., Garcia, J., Schuman, E., Bambha, R., Ermold, B., Eloranta, E., &
Garcia, J. High Spectral Resolution Lidar (HSRL). Atmospheric Radiation
Measurement (ARM) User Facility. https://doi.org/10.5439/1462207
/opt/conda/lib/python3.11/site-packages/dask/core.py:127: RuntimeWarning: invalid value encountered in log10
  return func(*(_execute_task(a, cache) for a in args))
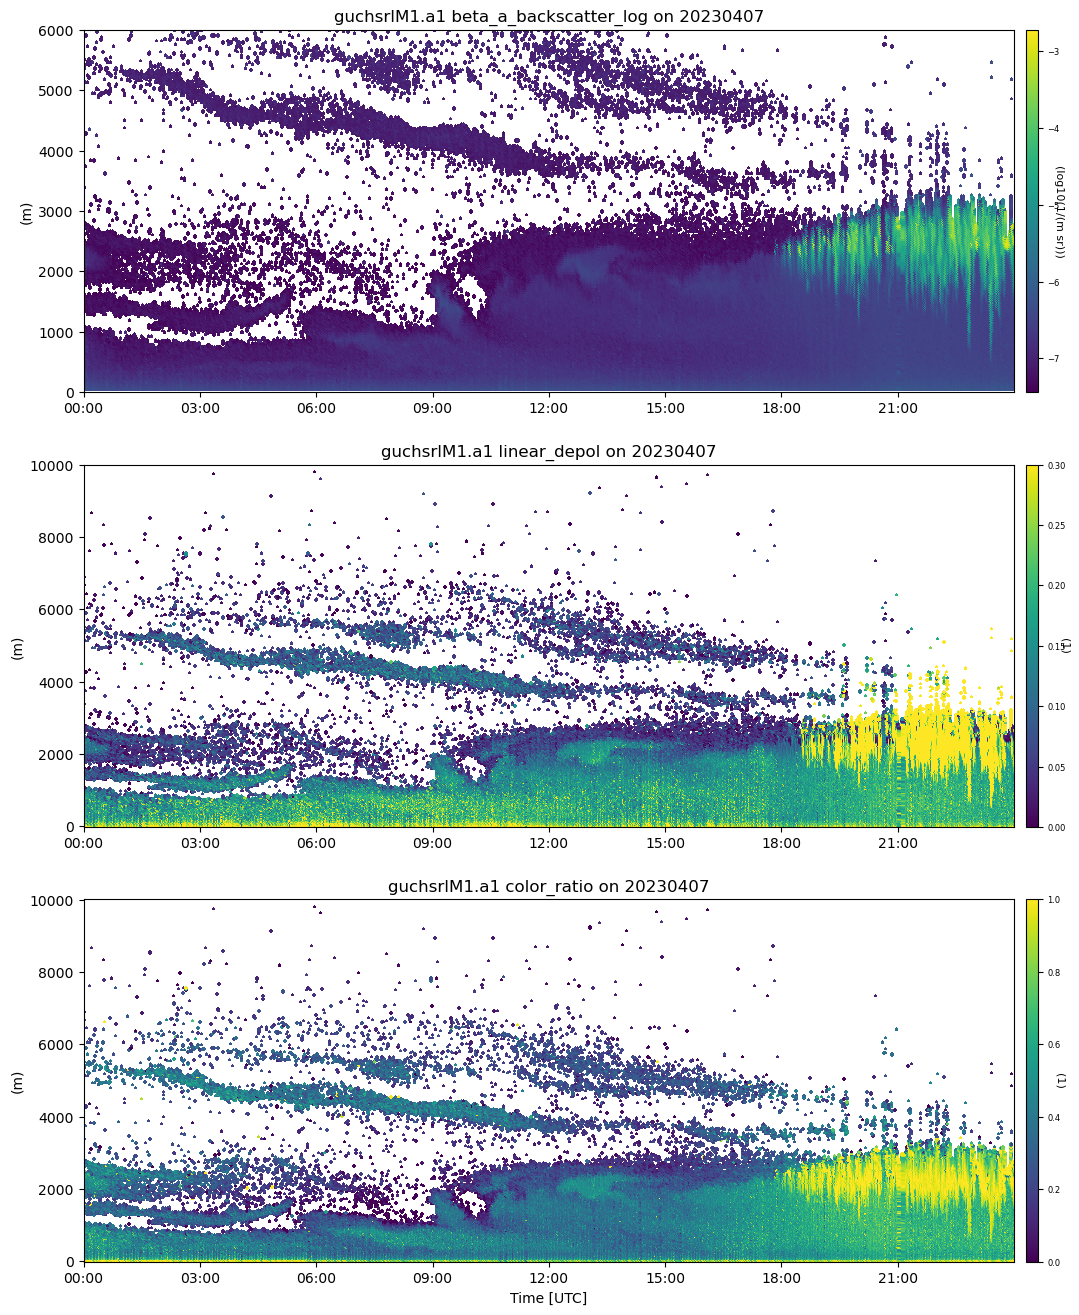
### April 7th, 2022 ###
# Set your username and token here!
username = 'username'
token = 'token'

# Set the datastream and start/enddates

datastream = 'guchsrlM1.a1'
startdate = '2023-04-7'
enddate = '2023-04-7'

# Use ACT to easily download the data.  Watch for the data citation!  Show some support
# for ARM's instrument experts and cite their data if you use it in a publication
result = act.discovery.download_arm_data(username, token, datastream, startdate, enddate)
result.sort()

ds = act.io.read_arm_netcdf(result)
ds.clean.cleanup()

# compute log of backscatter
ds['beta_a_backscatter_log'] = np.log10(ds['beta_a_backscatter'])
ds['beta_a_backscatter_log'].attrs['units'] = f"log10({ds['beta_a_backscatter'].attrs['units']})"
ds = ds.where(ds.range <= 10000, drop=True)

mask = ds['particulate_backscatter_signal_to_noise']>=3

#beta_a_backscatter - column backscatter
variables = ['beta_a_backscatter_log', 'linear_depol', 'color_ratio']

# watch out cloudy pixels
display = act.plotting.TimeSeriesDisplay(ds.where(mask),
                                         subplot_shape=(3,), figsize=(12,16))
display.plot(variables[0], subplot_index=(0,))
display.set_yrng([0, 6000], subplot_index=(0,))

# linear_depol indicates irregular aerosol
display.plot(variables[1], subplot_index=(1,), vmin = 0, vmax = 0.3)
display.set_yrng([0, 6000], subplot_index=(0,))

# color_ratio an indicator of aerosol particle size. Large aerosol particles have larger color_ratios
display.plot(variables[2], subplot_index=(2,), vmin = 0, vmax = 1)
display.set_yrng([0, 6000], subplot_index=(0,))

plt.show()
[DOWNLOADING] guchsrlM1.a1.20230407.000000.nc

If you use these data to prepare a publication, please cite:

Holz, R., Garcia, J., Schuman, E., Bambha, R., Ermold, B., Eloranta, E., &
Garcia, J. High Spectral Resolution Lidar (HSRL). Atmospheric Radiation
Measurement (ARM) User Facility. https://doi.org/10.5439/1462207
/opt/conda/lib/python3.11/site-packages/dask/core.py:127: RuntimeWarning: invalid value encountered in log10
  return func(*(_execute_task(a, cache) for a in args))
### April 8th, 2022 ###
# Set your username and token here!
username = 'username'
token = 'token'

# Set the datastream and start/enddates

datastream = 'guchsrlM1.a1'
startdate = '2023-04-8'
enddate = '2023-04-8'

# Use ACT to easily download the data.  Watch for the data citation!  Show some support
# for ARM's instrument experts and cite their data if you use it in a publication
result = act.discovery.download_arm_data(username, token, datastream, startdate, enddate)
result.sort()

ds = act.io.read_arm_netcdf(result)
ds.clean.cleanup()

# compute log of backscatter
ds['beta_a_backscatter_log'] = np.log10(ds['beta_a_backscatter'])
ds['beta_a_backscatter_log'].attrs['units'] = f"log10({ds['beta_a_backscatter'].attrs['units']})"
ds = ds.where(ds.range <= 10000, drop=True)

mask = ds['particulate_backscatter_signal_to_noise']>=3

#beta_a_backscatter - column backscatter
variables = ['beta_a_backscatter_log', 'linear_depol', 'color_ratio']

# watch out cloudy pixels
display = act.plotting.TimeSeriesDisplay(ds.where(mask),
                                         subplot_shape=(3,), figsize=(12,16))
display.plot(variables[0], subplot_index=(0,))
display.set_yrng([0, 6000], subplot_index=(0,))

# linear_depol indicates irregular aerosol
display.plot(variables[1], subplot_index=(1,), vmin = 0, vmax = 0.3)
display.set_yrng([0, 6000], subplot_index=(0,))

# color_ratio an indicator of aerosol particle size. Large aerosol particles have larger color_ratios
display.plot(variables[2], subplot_index=(2,), vmin = 0, vmax = 1)
display.set_yrng([0, 6000], subplot_index=(0,))

plt.show()
[DOWNLOADING] guchsrlM1.a1.20230408.000000.nc

If you use these data to prepare a publication, please cite:

Holz, R., Garcia, J., Schuman, E., Bambha, R., Ermold, B., Eloranta, E., &
Garcia, J. High Spectral Resolution Lidar (HSRL). Atmospheric Radiation
Measurement (ARM) User Facility. https://doi.org/10.5439/1462207
/opt/conda/lib/python3.11/site-packages/dask/core.py:127: RuntimeWarning: invalid value encountered in log10
  return func(*(_execute_task(a, cache) for a in args))