Plot downward longwave (LW) radiation at surface for WRF Simulations
WRF simulations serve as comparison to observations. Here the downward longwave radiation for the high black carbon loading event is considered. The results from the high dust event was difficult to interpret and is omitted.
import xarray as xr
import cartopy
import matplotlib
import matplotlib.pyplot as plt
from matplotlib.gridspec import GridSpec
%matplotlib inline
ERROR 1: PROJ: proj_create_from_database: Open of /opt/conda/share/proj failed
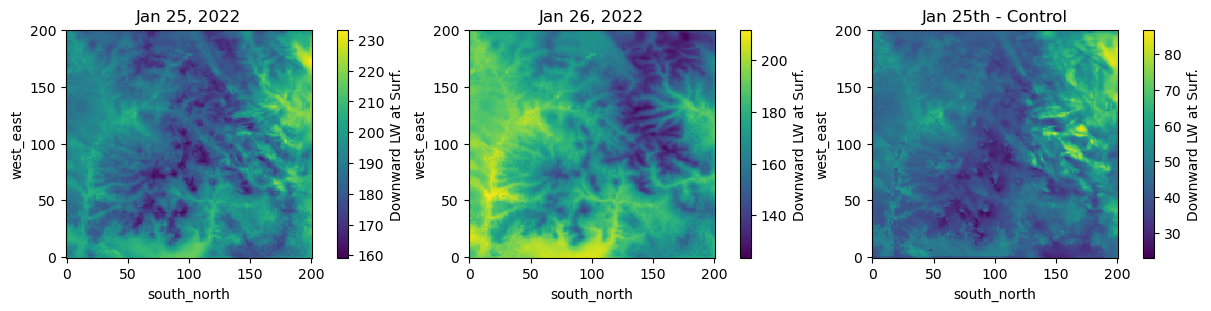
# Plot downward LW radiation at surface
# January 26th had no clouds so this day serves as comparison
dataset_25 = xr.open_mfdataset('wrf_data/jan_2022/wrfhourly_d03_2022-01-25.nc')
dataset_26 = xr.open_mfdataset('wrf_data/jan_2022/wrfhourly_d03_2022-01-26.nc')
dataset_02 = xr.open_mfdataset('wrf_data/jan_2022/wrfhourly_d03_2022-01-02.nc')
mean_dataset_diff = dataset_25.mean(dim="Time") - dataset_02.mean(dim="Time")

fig = plt.figure(figsize = (12,3),constrained_layout=True)

gs = GridSpec(1, 3, figure=fig)
ax1 = fig.add_subplot(gs[0, 0])
dataset_25.mean(dim="Time").GLW.plot(x='south_north',y='west_east',cbar_kwargs={'label': r"Downward LW at Surf."})
ax1.set_title('Jan 25, 2022')
ax2 = fig.add_subplot(gs[0, 1])
dataset_26.mean(dim="Time").GLW.plot(x='south_north',y='west_east',cbar_kwargs={'label': r"Downward LW at Surf."})
ax2.set_title('Jan 26, 2022')
ax3 = fig.add_subplot(gs[0, 2])
mean_dataset_diff.GLW.plot(x='south_north',y='west_east',cbar_kwargs={'label': r"Downward LW at Surf."})
ax3.set_title('Jan 25th - Control')
Text(0.5, 1.0, 'Jan 25th - Control')
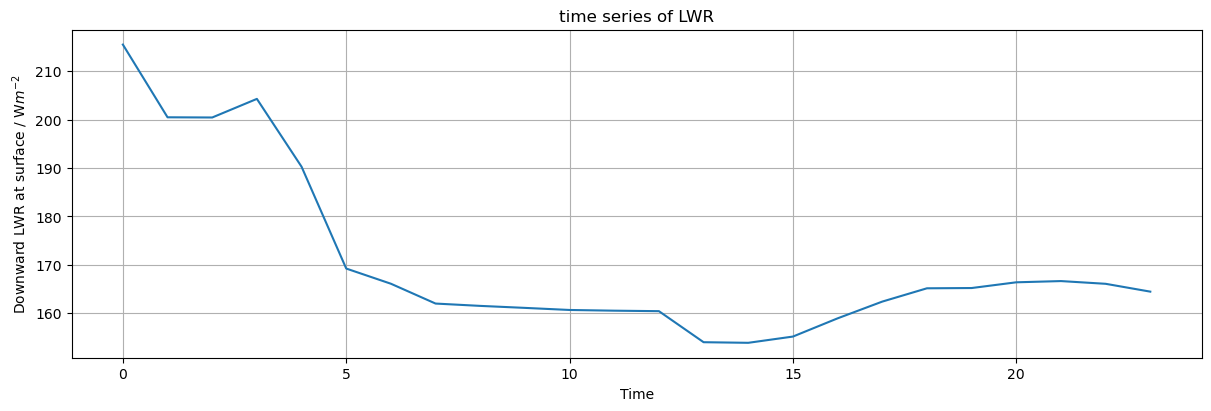
# plot time series of downward LW radiation for Jan 25
dataset_25 = xr.open_mfdataset('wrf_data/jan_2022/wrfhourly_d03_2022-01-25.nc')
time_series = dataset_25.mean(dim="south_north")
time_series = time_series.mean(dim="west_east")
fig = plt.figure(figsize = (12,4),constrained_layout=True)
time_series.GLW.plot()
plt.grid()
plt.title('time series of LWR')
plt.ylabel('Downward LWR at surface / W$m^{-2}$')
Text(0, 0.5, 'Downward LWR at surface / W$m^{-2}$')
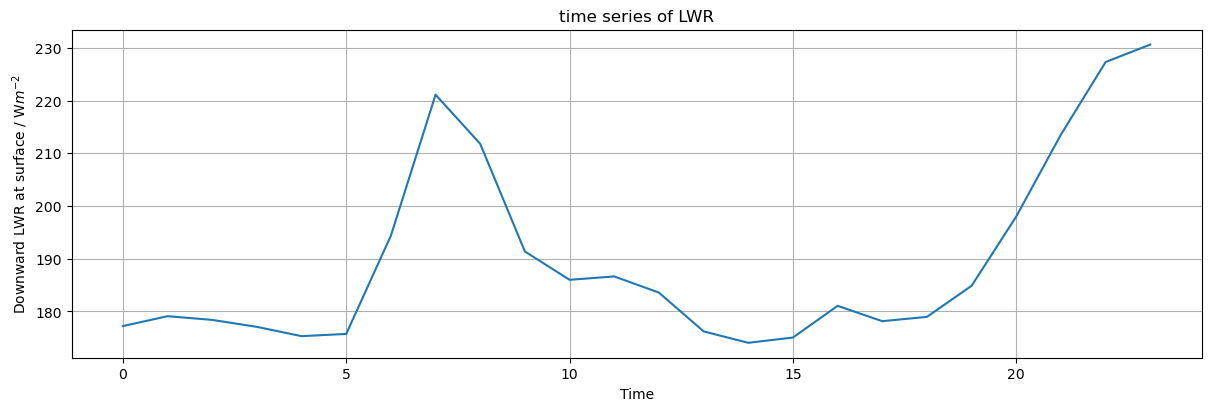
# plot time series of downward LW radiation for Jan 26
dataset_26 = xr.open_mfdataset('wrf_data/jan_2022/wrfhourly_d03_2022-01-26.nc')
time_series = dataset_26.mean(dim="south_north")
time_series = time_series.mean(dim="west_east")
fig = plt.figure(figsize = (12,4),constrained_layout=True)
time_series.GLW.plot()
plt.grid()
plt.title('time series of LWR')
plt.ylabel('Downward LWR at surface / W$m^{-2}$')
Text(0, 0.5, 'Downward LWR at surface / W$m^{-2}$')