Surface albedo measurements
import act
import numpy as np
import xarray as xr
import matplotlib.pyplot as plt
Load surface radiation measurements
# Set your username and token
username = 'yxie'
token = '8bb157033dfd0a5'

# Set the datastream and start/enddates
datastream = 'gucsebsM1.b1'

# Event #1 at January 2, 2022
startdate1 = '2022-01-02'
enddate1 = '2022-01-07'

# Event #2 at January 25, 2022
startdate2 = '2022-01-25'
enddate2 = '2022-01-30'

# Event #3 at April 3, 2023
startdate3 = '2023-04-03'
enddate3 = '2023-04-08'

# We are looking at 5 days after the event
numdate = 6

# Use ACT to easily download the data.  Watch for the data citation!  Show some support
# for ARM's instrument experts and cite their data if you use it in a publication
result1 = act.discovery.download_arm_data(username, token, datastream, startdate1, enddate1)
result2 = act.discovery.download_arm_data(username, token, datastream, startdate2, enddate2)
result3 = act.discovery.download_arm_data(username, token, datastream, startdate3, enddate3)
[DOWNLOADING] gucsebsM1.b1.20220102.000000.cdf
[DOWNLOADING] gucsebsM1.b1.20220103.000000.cdf
[DOWNLOADING] gucsebsM1.b1.20220104.000000.cdf
[DOWNLOADING] gucsebsM1.b1.20220105.000000.cdf
[DOWNLOADING] gucsebsM1.b1.20220106.000000.cdf
[DOWNLOADING] gucsebsM1.b1.20220107.000000.cdf

If you use these data to prepare a publication, please cite:

Sullivan, R., Keeler, E., Pal, S., & Kyrouac, J. Surface Energy Balance System
(SEBS). Atmospheric Radiation Measurement (ARM) User Facility.
https://doi.org/10.5439/1984921

[DOWNLOADING] gucsebsM1.b1.20220125.000000.cdf
[DOWNLOADING] gucsebsM1.b1.20220126.000000.cdf
[DOWNLOADING] gucsebsM1.b1.20220127.000000.cdf
[DOWNLOADING] gucsebsM1.b1.20220128.000000.cdf
[DOWNLOADING] gucsebsM1.b1.20220129.000000.cdf
[DOWNLOADING] gucsebsM1.b1.20220130.000000.cdf

If you use these data to prepare a publication, please cite:

Sullivan, R., Keeler, E., Pal, S., & Kyrouac, J. Surface Energy Balance System
(SEBS). Atmospheric Radiation Measurement (ARM) User Facility.
https://doi.org/10.5439/1984921

[DOWNLOADING] gucsebsM1.b1.20230403.000000.cdf
[DOWNLOADING] gucsebsM1.b1.20230404.000000.cdf
[DOWNLOADING] gucsebsM1.b1.20230405.000000.cdf
[DOWNLOADING] gucsebsM1.b1.20230406.000000.cdf
[DOWNLOADING] gucsebsM1.b1.20230407.000000.cdf
[DOWNLOADING] gucsebsM1.b1.20230408.000000.cdf

If you use these data to prepare a publication, please cite:

Sullivan, R., Keeler, E., Pal, S., & Kyrouac, J. Surface Energy Balance System
(SEBS). Atmospheric Radiation Measurement (ARM) User Facility.
https://doi.org/10.5439/1984921
# Let's read in the data using ACT and check out the data
ds_rad1 = act.io.read_arm_netcdf(result1)
ds_rad2 = act.io.read_arm_netcdf(result2)
ds_rad3 = act.io.read_arm_netcdf(result3)
# Quality Check the data
# Remove the bad data
ds_rad1.clean.cleanup()
#ds_rad = act.qc.arm.add_dqr_to_qc(ds_rad)
ds_rad1.qcfilter.datafilter(rm_assessments=['Bad'], del_qc_var=False)

ds_rad2.clean.cleanup()
ds_rad2.qcfilter.datafilter(rm_assessments=['Bad'], del_qc_var=False)

ds_rad3.clean.cleanup()
ds_rad3.qcfilter.datafilter(rm_assessments=['Bad'], del_qc_var=False)
# check the data structure
ds_rad1
<xarray.Dataset> Size: 85kB
Dimensions:                        (time: 288)
Coordinates:
  * time                           (time) datetime64[ns] 2kB 2022-01-02 ... 2...
Data variables: (12/70)
    base_time                      (time) datetime64[ns] 2kB 2022-01-02 ... 2...
    time_offset                    (time) datetime64[ns] 2kB 2022-01-02 ... 2...
    qc_time                        (time) int32 1kB dask.array<chunksize=(48,), meta=np.ndarray>
    down_short_hemisp              (time) float32 1kB dask.array<chunksize=(48,), meta=np.ndarray>
    qc_down_short_hemisp           (time) int32 1kB 0 2 2 2 2 2 ... 0 0 0 0 0 0
    up_short_hemisp                (time) float32 1kB dask.array<chunksize=(48,), meta=np.ndarray>
    ...                             ...
    qc_temp_net_radiometer         (time) int32 1kB 0 0 0 0 0 0 ... 0 0 0 0 0 0
    battery_voltage                (time) float32 1kB dask.array<chunksize=(48,), meta=np.ndarray>
    qc_battery_voltage             (time) int32 1kB 0 0 0 0 0 0 ... 0 0 0 0 0 0
    lat                            (time) float32 1kB 38.96 38.96 ... 38.96
    lon                            (time) float32 1kB -107.0 -107.0 ... -107.0
    alt                            (time) float32 1kB 2.886e+03 ... 2.886e+03
Attributes: (12/22)
    command_line:            sebs_ingest -s guc -f M1
    process_version:         ingest-sebs-1.6-0.el7
    ingest_software:         ingest-sebs-1.6-0.el7
    dod_version:             sebs-b1-1.4
    site_id:                 guc
    facility_id:             M1: Mt Crested Butte, Colorado
    ...                      ...
    datastream:              gucsebsM1.b1
    history:                 created by user dsmgr on machine procnode2 at 20...
    _file_dates:             ['20220102', '20220103', '20220104', '20220105',...
    _file_times:             ['000000', '000000', '000000', '000000', '000000...
    _datastream:             gucsebsM1.b1
    _arm_standards_flag:     1
xarray.Dataset
- time: 288
- time(time)datetime64[ns]2022-01-02 ... 2022-01-07T23:30:00
- long_name :
- Time offset from midnight
- ancillary_variables :
- qc_time
array(['2022-01-02T00:00:00.000000000', '2022-01-02T00:30:00.000000000',
       '2022-01-02T01:00:00.000000000', ..., '2022-01-07T22:30:00.000000000',
       '2022-01-07T23:00:00.000000000', '2022-01-07T23:30:00.000000000'],
      dtype='datetime64[ns]')
- base_time(time)datetime64[ns]2022-01-02 ... 2022-01-07
- string :
- 2022-01-02 00:00:00 0:00
- long_name :
- Base time in Epoch
array(['2022-01-02T00:00:00.000000000', '2022-01-02T00:00:00.000000000', '2022-01-02T00:00:00.000000000', '2022-01-02T00:00:00.000000000', '2022-01-02T00:00:00.000000000', '2022-01-02T00:00:00.000000000', '2022-01-02T00:00:00.000000000', '2022-01-02T00:00:00.000000000', '2022-01-02T00:00:00.000000000', '2022-01-02T00:00:00.000000000', '2022-01-02T00:00:00.000000000', '2022-01-02T00:00:00.000000000', '2022-01-02T00:00:00.000000000', '2022-01-02T00:00:00.000000000', '2022-01-02T00:00:00.000000000', '2022-01-02T00:00:00.000000000', '2022-01-02T00:00:00.000000000', '2022-01-02T00:00:00.000000000', '2022-01-02T00:00:00.000000000', '2022-01-02T00:00:00.000000000', '2022-01-02T00:00:00.000000000', '2022-01-02T00:00:00.000000000', '2022-01-02T00:00:00.000000000', '2022-01-02T00:00:00.000000000', '2022-01-02T00:00:00.000000000', '2022-01-02T00:00:00.000000000', '2022-01-02T00:00:00.000000000', '2022-01-02T00:00:00.000000000', '2022-01-02T00:00:00.000000000', '2022-01-02T00:00:00.000000000', '2022-01-02T00:00:00.000000000', '2022-01-02T00:00:00.000000000', '2022-01-02T00:00:00.000000000', '2022-01-02T00:00:00.000000000', '2022-01-02T00:00:00.000000000', '2022-01-02T00:00:00.000000000', '2022-01-02T00:00:00.000000000', '2022-01-02T00:00:00.000000000', '2022-01-02T00:00:00.000000000', '2022-01-02T00:00:00.000000000', ... '2022-01-07T00:00:00.000000000', '2022-01-07T00:00:00.000000000', '2022-01-07T00:00:00.000000000', '2022-01-07T00:00:00.000000000', '2022-01-07T00:00:00.000000000', '2022-01-07T00:00:00.000000000', '2022-01-07T00:00:00.000000000', '2022-01-07T00:00:00.000000000', '2022-01-07T00:00:00.000000000', '2022-01-07T00:00:00.000000000', '2022-01-07T00:00:00.000000000', '2022-01-07T00:00:00.000000000', '2022-01-07T00:00:00.000000000', '2022-01-07T00:00:00.000000000', '2022-01-07T00:00:00.000000000', '2022-01-07T00:00:00.000000000', '2022-01-07T00:00:00.000000000', '2022-01-07T00:00:00.000000000', '2022-01-07T00:00:00.000000000', '2022-01-07T00:00:00.000000000', '2022-01-07T00:00:00.000000000', '2022-01-07T00:00:00.000000000', '2022-01-07T00:00:00.000000000', '2022-01-07T00:00:00.000000000', '2022-01-07T00:00:00.000000000', '2022-01-07T00:00:00.000000000', '2022-01-07T00:00:00.000000000', '2022-01-07T00:00:00.000000000', '2022-01-07T00:00:00.000000000', '2022-01-07T00:00:00.000000000', '2022-01-07T00:00:00.000000000', '2022-01-07T00:00:00.000000000', '2022-01-07T00:00:00.000000000', '2022-01-07T00:00:00.000000000', '2022-01-07T00:00:00.000000000', '2022-01-07T00:00:00.000000000', '2022-01-07T00:00:00.000000000', '2022-01-07T00:00:00.000000000'], dtype='datetime64[ns]') - time_offset(time)datetime64[ns]2022-01-02 ... 2022-01-07T23:30:00
- long_name :
- Time offset from base_time
array(['2022-01-02T00:00:00.000000000', '2022-01-02T00:30:00.000000000', '2022-01-02T01:00:00.000000000', '2022-01-02T01:30:00.000000000', '2022-01-02T02:00:00.000000000', '2022-01-02T02:30:00.000000000', '2022-01-02T03:00:00.000000000', '2022-01-02T03:30:00.000000000', '2022-01-02T04:00:00.000000000', '2022-01-02T04:30:00.000000000', '2022-01-02T05:00:00.000000000', '2022-01-02T05:30:00.000000000', '2022-01-02T06:00:00.000000000', '2022-01-02T06:30:00.000000000', '2022-01-02T07:00:00.000000000', '2022-01-02T07:30:00.000000000', '2022-01-02T08:00:00.000000000', '2022-01-02T08:30:00.000000000', '2022-01-02T09:00:00.000000000', '2022-01-02T09:30:00.000000000', '2022-01-02T10:00:00.000000000', '2022-01-02T10:30:00.000000000', '2022-01-02T11:00:00.000000000', '2022-01-02T11:30:00.000000000', '2022-01-02T12:00:00.000000000', '2022-01-02T12:30:00.000000000', '2022-01-02T13:00:00.000000000', '2022-01-02T13:30:00.000000000', '2022-01-02T14:00:00.000000000', '2022-01-02T14:30:00.000000000', '2022-01-02T15:00:00.000000000', '2022-01-02T15:30:00.000000000', '2022-01-02T16:00:00.000000000', '2022-01-02T16:30:00.000000000', '2022-01-02T17:00:00.000000000', '2022-01-02T17:30:00.000000000', '2022-01-02T18:00:00.000000000', '2022-01-02T18:30:00.000000000', '2022-01-02T19:00:00.000000000', '2022-01-02T19:30:00.000000000', ... '2022-01-07T05:00:00.000000000', '2022-01-07T05:30:00.000000000', '2022-01-07T06:00:00.000000000', '2022-01-07T06:30:00.000000000', '2022-01-07T07:00:00.000000000', '2022-01-07T07:30:00.000000000', '2022-01-07T08:00:00.000000000', '2022-01-07T08:30:00.000000000', '2022-01-07T09:00:00.000000000', '2022-01-07T09:30:00.000000000', '2022-01-07T10:00:00.000000000', '2022-01-07T10:30:00.000000000', '2022-01-07T11:00:00.000000000', '2022-01-07T11:30:00.000000000', '2022-01-07T12:00:00.000000000', '2022-01-07T12:30:00.000000000', '2022-01-07T13:00:00.000000000', '2022-01-07T13:30:00.000000000', '2022-01-07T14:00:00.000000000', '2022-01-07T14:30:00.000000000', '2022-01-07T15:00:00.000000000', '2022-01-07T15:30:00.000000000', '2022-01-07T16:00:00.000000000', '2022-01-07T16:30:00.000000000', '2022-01-07T17:00:00.000000000', '2022-01-07T17:30:00.000000000', '2022-01-07T18:00:00.000000000', '2022-01-07T18:30:00.000000000', '2022-01-07T19:00:00.000000000', '2022-01-07T19:30:00.000000000', '2022-01-07T20:00:00.000000000', '2022-01-07T20:30:00.000000000', '2022-01-07T21:00:00.000000000', '2022-01-07T21:30:00.000000000', '2022-01-07T22:00:00.000000000', '2022-01-07T22:30:00.000000000', '2022-01-07T23:00:00.000000000', '2022-01-07T23:30:00.000000000'], dtype='datetime64[ns]') - qc_time(time)int32dask.array<chunksize=(48,), meta=np.ndarray>
- long_name :
- Quality check results on field: Time offset from midnight
- units :
- 1
- delta_t_lower_limit :
- 1797.0
- delta_t_upper_limit :
- 1803.0
- prior_sample_flag :
- 1
- comment :
- If the 'prior_sample_flag' is set the first sample time from a new raw file will be compared against the time just previous to it in the stored data. If it is not set the qc_time value for the first sample will be set to 0.
- flag_masks :
- [1, 2, 4]
- flag_meanings :
- ['Delta time between current and previous samples is zero.', 'Delta time between current and previous samples is less than the delta_t_lower_limit field attribute.', 'Delta time between current and previous samples is greater than the delta_t_upper_limit field attribute.']
- flag_assessments :
- ['Indeterminate', 'Indeterminate', 'Indeterminate']
- standard_name :
- quality_flag
Array Chunk Bytes 1.12 kiB 192 B Shape (288,) (48,) Dask graph 6 chunks in 13 graph layers Data type int32 numpy.ndarray - down_short_hemisp(time)float32dask.array<chunksize=(48,), meta=np.ndarray>
- long_name :
- Downwelling shortwave hemispheric irradiance
- units :
- W/m^2
- resolution :
- 0.1
- ancillary_variables :
- qc_down_short_hemisp
- history :
- act.qc.datafilter: Value is equal to missing_value. act.qc.datafilter: Value is less than the fail_min. act.qc.datafilter: Value is greater than the fail_max.
Array Chunk Bytes 1.12 kiB 192 B Shape (288,) (48,) Dask graph 6 chunks in 1 graph layer Data type float32 numpy.ndarray - qc_down_short_hemisp(time)int320 2 2 2 2 2 2 2 ... 0 0 0 0 0 0 0 0
- long_name :
- Quality check results on field: Downwelling shortwave hemispheric irradiance
- units :
- 1
- flag_masks :
- [1, 2, 4]
- flag_meanings :
- ['Value is equal to missing_value.', 'Value is less than the fail_min.', 'Value is greater than the fail_max.']
- flag_assessments :
- ['Bad', 'Bad', 'Bad']
- fail_min :
- 0.0
- fail_max :
- 1200.0
- standard_name :
- quality_flag
array([0, 2, 2, 2, 2, 2, 2, 2, 2, 2, 2, 2, 2, 2, 2, 2, 2, 2, 2, 2, 2, 2, 2, 2, 2, 2, 2, 2, 2, 2, 0, 0, 0, 0, 0, 0, 0, 0, 0, 0, 0, 0, 0, 0, 0, 0, 0, 0, 0, 2, 2, 2, 2, 2, 2, 2, 2, 2, 2, 2, 2, 2, 2, 2, 2, 2, 2, 2, 2, 2, 2, 2, 2, 2, 2, 2, 2, 2, 0, 0, 0, 0, 0, 0, 0, 0, 0, 0, 0, 0, 0, 0, 0, 0, 0, 0, 0, 2, 2, 2, 2, 2, 2, 2, 2, 2, 2, 2, 2, 2, 2, 2, 2, 2, 2, 2, 2, 2, 2, 2, 2, 2, 2, 2, 2, 2, 0, 0, 0, 0, 0, 0, 0, 0, 0, 0, 0, 0, 0, 0, 0, 0, 0, 0, 0, 2, 2, 2, 2, 2, 2, 2, 2, 2, 2, 2, 2, 2, 2, 2, 2, 2, 2, 2, 2, 2, 2, 2, 2, 2, 2, 2, 2, 2, 0, 0, 0, 0, 0, 0, 0, 0, 0, 0, 0, 0, 0, 0, 0, 0, 0, 0, 0, 2, 2, 2, 2, 2, 2, 2, 2, 2, 2, 2, 2, 2, 2, 2, 2, 2, 2, 2, 2, 2, 2, 2, 2, 2, 2, 2, 2, 2, 0, 0, 0, 0, 0, 0, 0, 0, 0, 0, 0, 0, 0, 0, 0, 0, 0, 0, 0, 2, 2, 2, 2, 2, 2, 2, 2, 2, 2, 2, 2, 2, 2, 2, 2, 2, 2, 2, 2, 2, 2, 2, 2, 2, 2, 2, 2, 2, 0, 0, 0, 0, 0, 0, 0, 0, 0, 0, 0, 0, 0, 0, 0, 0, 0, 0], dtype=int32) - up_short_hemisp(time)float32dask.array<chunksize=(48,), meta=np.ndarray>
- long_name :
- Upwelling shortwave hemispheric irradiance
- units :
- W/m^2
- resolution :
- 0.1
- ancillary_variables :
- qc_up_short_hemisp
- history :
- act.qc.datafilter: Value is equal to missing_value. act.qc.datafilter: Value is less than the fail_min. act.qc.datafilter: Value is greater than the fail_max.
Array Chunk Bytes 1.12 kiB 192 B Shape (288,) (48,) Dask graph 6 chunks in 1 graph layer Data type float32 numpy.ndarray - qc_up_short_hemisp(time)int320 2 2 2 2 2 2 2 ... 0 0 0 0 0 0 0 0
- long_name :
- Quality check results on field: Upwelling shortwave hemispheric irradiance
- units :
- 1
- flag_masks :
- [1, 2, 4]
- flag_meanings :
- ['Value is equal to missing_value.', 'Value is less than the fail_min.', 'Value is greater than the fail_max.']
- flag_assessments :
- ['Bad', 'Bad', 'Bad']
- fail_min :
- 0.0
- fail_max :
- 1200.0
- standard_name :
- quality_flag
array([0, 2, 2, 2, 2, 2, 2, 2, 2, 2, 2, 2, 2, 2, 2, 2, 2, 2, 2, 2, 2, 2, 2, 2, 2, 2, 2, 2, 2, 0, 0, 0, 0, 0, 0, 0, 0, 0, 0, 0, 0, 0, 0, 0, 0, 0, 0, 0, 0, 2, 2, 2, 2, 2, 2, 2, 2, 2, 2, 2, 2, 2, 2, 2, 2, 2, 2, 2, 2, 2, 2, 2, 2, 2, 2, 2, 2, 2, 0, 0, 0, 0, 0, 0, 0, 0, 0, 0, 0, 0, 0, 0, 0, 0, 0, 0, 0, 2, 2, 2, 2, 2, 2, 2, 2, 2, 2, 2, 2, 2, 2, 2, 2, 2, 2, 2, 2, 2, 2, 2, 2, 2, 2, 2, 2, 2, 0, 0, 0, 0, 0, 0, 0, 0, 0, 0, 0, 0, 0, 0, 0, 0, 0, 0, 0, 2, 2, 2, 2, 2, 2, 2, 2, 2, 2, 2, 2, 2, 2, 2, 2, 2, 2, 2, 2, 2, 2, 2, 2, 2, 2, 2, 2, 2, 0, 0, 0, 0, 0, 0, 0, 0, 0, 0, 0, 0, 0, 0, 0, 0, 0, 0, 0, 2, 2, 2, 2, 2, 2, 2, 2, 2, 2, 2, 2, 2, 2, 2, 2, 2, 2, 2, 2, 2, 2, 2, 2, 2, 2, 2, 2, 2, 0, 0, 0, 0, 0, 0, 0, 0, 0, 0, 0, 0, 0, 0, 0, 0, 0, 0, 0, 2, 2, 2, 2, 2, 2, 2, 2, 2, 2, 2, 2, 2, 2, 2, 2, 2, 2, 2, 2, 2, 2, 2, 2, 2, 2, 2, 2, 2, 0, 0, 0, 0, 0, 0, 0, 0, 0, 0, 0, 0, 0, 0, 0, 0, 0, 0], dtype=int32) - down_long(time)float32dask.array<chunksize=(48,), meta=np.ndarray>
- long_name :
- Sky longwave irradiance
- units :
- W/m^2
- resolution :
- 0.1
- ancillary_variables :
- qc_down_long
- history :
- act.qc.datafilter: Value is equal to missing_value. act.qc.datafilter: Value is less than the fail_min. act.qc.datafilter: Value is greater than the fail_max.
Array Chunk Bytes 1.12 kiB 192 B Shape (288,) (48,) Dask graph 6 chunks in 1 graph layer Data type float32 numpy.ndarray - qc_down_long(time)int320 0 0 0 0 0 0 0 ... 0 0 0 0 0 0 0 0
- long_name :
- Quality check results on field: Sky longwave irradiance
- units :
- 1
- flag_masks :
- [1, 2, 4]
- flag_meanings :
- ['Value is equal to missing_value.', 'Value is less than the fail_min.', 'Value is greater than the fail_max.']
- flag_assessments :
- ['Bad', 'Bad', 'Bad']
- fail_min :
- 0.0
- fail_max :
- 800.0
- standard_name :
- quality_flag
array([0, 0, 0, 0, 0, 0, 0, 0, 0, 0, 0, 0, 0, 0, 0, 0, 0, 0, 0, 0, 0, 0, 0, 0, 0, 0, 0, 0, 0, 0, 0, 0, 0, 0, 0, 0, 0, 0, 0, 0, 0, 0, 0, 0, 0, 0, 0, 0, 0, 0, 0, 0, 0, 0, 0, 0, 0, 0, 0, 0, 0, 0, 0, 0, 0, 0, 0, 0, 0, 0, 0, 0, 0, 0, 0, 0, 0, 0, 0, 0, 0, 0, 0, 0, 0, 0, 0, 0, 0, 0, 0, 0, 0, 0, 0, 0, 0, 0, 0, 0, 0, 0, 0, 0, 0, 0, 0, 0, 0, 0, 0, 0, 0, 0, 0, 0, 0, 0, 0, 0, 0, 0, 0, 0, 0, 0, 0, 0, 0, 0, 0, 0, 0, 0, 0, 0, 0, 0, 0, 0, 0, 0, 0, 0, 0, 0, 0, 0, 0, 0, 0, 0, 0, 0, 0, 0, 0, 0, 0, 0, 0, 0, 0, 0, 0, 0, 0, 0, 0, 0, 0, 0, 0, 0, 0, 0, 0, 0, 0, 0, 0, 0, 0, 0, 0, 0, 0, 0, 0, 0, 0, 0, 0, 0, 0, 0, 0, 0, 0, 0, 0, 0, 0, 0, 0, 0, 0, 0, 0, 0, 0, 0, 0, 0, 0, 0, 0, 0, 0, 0, 0, 0, 0, 0, 0, 0, 0, 0, 0, 0, 0, 0, 0, 0, 0, 0, 0, 0, 0, 0, 0, 0, 0, 0, 0, 0, 0, 0, 0, 0, 0, 0, 0, 0, 0, 0, 0, 0, 0, 0, 0, 0, 0, 0, 0, 0, 0, 0, 0, 0, 0, 0, 0, 0, 0, 0, 0, 0, 0, 0, 0, 0, 0, 0, 0, 0, 0, 0], dtype=int32) - up_long(time)float32dask.array<chunksize=(48,), meta=np.ndarray>
- long_name :
- Surface longwave irradiance
- units :
- w/m^2
- resolution :
- 0.1
- ancillary_variables :
- qc_up_long
- history :
- act.qc.datafilter: Value is equal to missing_value. act.qc.datafilter: Value is less than the fail_min. act.qc.datafilter: Value is greater than the fail_max.
Array Chunk Bytes 1.12 kiB 192 B Shape (288,) (48,) Dask graph 6 chunks in 1 graph layer Data type float32 numpy.ndarray - qc_up_long(time)int320 0 0 0 0 0 0 0 ... 0 0 0 0 0 0 0 0
- long_name :
- Quality check results on field: Surface longwave irradiance
- units :
- 1
- flag_masks :
- [1, 2, 4]
- flag_meanings :
- ['Value is equal to missing_value.', 'Value is less than the fail_min.', 'Value is greater than the fail_max.']
- flag_assessments :
- ['Bad', 'Bad', 'Bad']
- fail_min :
- 0.0
- fail_max :
- 800.0
- standard_name :
- quality_flag
array([0, 0, 0, 0, 0, 0, 0, 0, 0, 0, 0, 0, 0, 0, 0, 0, 0, 0, 0, 0, 0, 0, 0, 0, 0, 0, 0, 0, 0, 0, 0, 0, 0, 0, 0, 0, 0, 0, 0, 0, 0, 0, 0, 0, 0, 0, 0, 0, 0, 0, 0, 0, 0, 0, 0, 0, 0, 0, 0, 0, 0, 0, 0, 0, 0, 0, 0, 0, 0, 0, 0, 0, 0, 0, 0, 0, 0, 0, 0, 0, 0, 0, 0, 0, 0, 0, 0, 0, 0, 0, 0, 0, 0, 0, 0, 0, 0, 0, 0, 0, 0, 0, 0, 0, 0, 0, 0, 0, 0, 0, 0, 0, 0, 0, 0, 0, 0, 0, 0, 0, 0, 0, 0, 0, 0, 0, 0, 0, 0, 0, 0, 0, 0, 0, 0, 0, 0, 0, 0, 0, 0, 0, 0, 0, 0, 0, 0, 0, 0, 0, 0, 0, 0, 0, 0, 0, 0, 0, 0, 0, 0, 0, 0, 0, 0, 0, 0, 0, 0, 0, 0, 0, 0, 0, 0, 0, 0, 0, 0, 0, 0, 0, 0, 0, 0, 0, 0, 0, 0, 0, 0, 0, 0, 0, 0, 0, 0, 0, 0, 0, 0, 0, 0, 0, 0, 0, 0, 0, 0, 0, 0, 0, 0, 0, 0, 0, 0, 0, 0, 0, 0, 0, 0, 0, 0, 0, 0, 0, 0, 0, 0, 0, 0, 0, 0, 0, 0, 0, 0, 0, 0, 0, 0, 0, 0, 0, 0, 0, 0, 0, 0, 0, 0, 0, 0, 0, 0, 0, 0, 0, 0, 0, 0, 0, 0, 0, 0, 0, 0, 0, 0, 0, 0, 0, 0, 0, 0, 0, 0, 0, 0, 0, 0, 0, 0, 0, 0, 0], dtype=int32) - surface_soil_heat_flux_1(time)float32dask.array<chunksize=(48,), meta=np.ndarray>
- long_name :
- Surface soil heat flux 1
- units :
- W/m^2
- resolution :
- 0.1
- ancillary_variables :
- qc_surface_soil_heat_flux_1
- history :
- act.qc.datafilter: Value is equal to missing_value. act.qc.datafilter: Value is less than the fail_min. act.qc.datafilter: Value is greater than the fail_max.
Array Chunk Bytes 1.12 kiB 192 B Shape (288,) (48,) Dask graph 6 chunks in 1 graph layer Data type float32 numpy.ndarray - qc_surface_soil_heat_flux_1(time)int320 0 0 0 0 0 0 0 ... 0 0 0 0 0 0 0 0
- long_name :
- Quality check results on field: Surface soil heat flux 1
- units :
- 1
- flag_masks :
- [1, 2, 4]
- flag_meanings :
- ['Value is equal to missing_value.', 'Value is less than the fail_min.', 'Value is greater than the fail_max.']
- flag_assessments :
- ['Bad', 'Bad', 'Bad']
- fail_min :
- -200.0
- fail_max :
- 100.0
- standard_name :
- quality_flag
array([0, 0, 0, 0, 0, 0, 0, 0, 0, 0, 0, 0, 0, 0, 0, 0, 0, 0, 0, 0, 0, 0, 0, 0, 0, 0, 0, 0, 0, 0, 0, 0, 0, 0, 0, 0, 0, 0, 0, 0, 0, 0, 0, 0, 0, 0, 0, 0, 0, 0, 0, 0, 0, 0, 0, 0, 0, 0, 0, 0, 0, 0, 0, 0, 0, 0, 0, 0, 0, 0, 0, 0, 0, 0, 0, 0, 0, 0, 0, 0, 0, 0, 0, 0, 0, 0, 0, 0, 0, 0, 0, 0, 0, 0, 0, 0, 0, 0, 0, 0, 0, 0, 0, 0, 0, 0, 0, 0, 0, 0, 0, 0, 0, 0, 0, 0, 0, 0, 0, 0, 0, 0, 0, 0, 0, 0, 0, 0, 0, 0, 0, 0, 0, 0, 0, 0, 0, 0, 0, 0, 0, 0, 0, 0, 0, 0, 0, 0, 0, 0, 0, 0, 0, 0, 0, 0, 0, 0, 0, 0, 0, 0, 0, 0, 0, 0, 0, 0, 0, 0, 0, 0, 0, 0, 0, 0, 0, 0, 0, 0, 0, 0, 0, 0, 0, 0, 0, 0, 0, 0, 0, 0, 0, 0, 0, 0, 0, 0, 0, 0, 0, 0, 0, 0, 0, 0, 0, 0, 0, 0, 0, 0, 0, 0, 0, 0, 0, 0, 0, 0, 0, 0, 0, 0, 0, 0, 0, 0, 0, 0, 0, 0, 0, 0, 0, 0, 0, 0, 0, 0, 0, 0, 0, 0, 0, 0, 0, 0, 0, 0, 0, 0, 0, 0, 0, 0, 0, 0, 0, 0, 0, 0, 0, 0, 0, 0, 0, 0, 0, 0, 0, 0, 0, 0, 0, 0, 0, 0, 0, 0, 0, 0, 0, 0, 0, 0, 0, 0], dtype=int32) - surface_soil_heat_flux_2(time)float32dask.array<chunksize=(48,), meta=np.ndarray>
- long_name :
- Surface soil heat flux 2
- units :
- W/m^2
- resolution :
- 0.1
- ancillary_variables :
- qc_surface_soil_heat_flux_2
- history :
- act.qc.datafilter: Value is equal to missing_value. act.qc.datafilter: Value is less than the fail_min. act.qc.datafilter: Value is greater than the fail_max.
Array Chunk Bytes 1.12 kiB 192 B Shape (288,) (48,) Dask graph 6 chunks in 1 graph layer Data type float32 numpy.ndarray - qc_surface_soil_heat_flux_2(time)int320 0 0 0 0 0 0 0 ... 0 0 0 0 0 0 0 0
- long_name :
- Quality check results on field: Surface soil heat flux 2
- units :
- 1
- flag_masks :
- [1, 2, 4]
- flag_meanings :
- ['Value is equal to missing_value.', 'Value is less than the fail_min.', 'Value is greater than the fail_max.']
- flag_assessments :
- ['Bad', 'Bad', 'Bad']
- fail_min :
- -200.0
- fail_max :
- 100.0
- standard_name :
- quality_flag
array([0, 0, 0, 0, 0, 0, 0, 0, 0, 0, 0, 0, 0, 0, 0, 0, 0, 0, 0, 0, 0, 0, 0, 0, 0, 0, 0, 0, 0, 0, 0, 0, 0, 0, 0, 0, 0, 0, 0, 0, 0, 0, 0, 0, 0, 0, 0, 0, 0, 0, 0, 0, 0, 0, 0, 0, 0, 0, 0, 0, 0, 0, 0, 0, 0, 0, 0, 0, 0, 0, 0, 0, 0, 0, 0, 0, 0, 0, 0, 0, 0, 0, 0, 0, 0, 0, 0, 0, 0, 0, 0, 0, 0, 0, 0, 0, 0, 0, 0, 0, 0, 0, 0, 0, 0, 0, 0, 0, 0, 0, 0, 0, 0, 0, 0, 0, 0, 0, 0, 0, 0, 0, 0, 0, 0, 0, 0, 0, 0, 0, 0, 0, 0, 0, 0, 0, 0, 0, 0, 0, 0, 0, 0, 0, 0, 0, 0, 0, 0, 0, 0, 0, 0, 0, 0, 0, 0, 0, 0, 0, 0, 0, 0, 0, 0, 0, 0, 0, 0, 0, 0, 0, 0, 0, 0, 0, 0, 0, 0, 0, 0, 0, 0, 0, 0, 0, 0, 0, 0, 0, 0, 0, 0, 0, 0, 0, 0, 0, 0, 0, 0, 0, 0, 0, 0, 0, 0, 0, 0, 0, 0, 0, 0, 0, 0, 0, 0, 0, 0, 0, 0, 0, 0, 0, 0, 0, 0, 0, 0, 0, 0, 0, 0, 0, 0, 0, 0, 0, 0, 0, 0, 0, 0, 0, 0, 0, 0, 0, 0, 0, 0, 0, 0, 0, 0, 0, 0, 0, 0, 0, 0, 0, 0, 0, 0, 0, 0, 0, 0, 0, 0, 0, 0, 0, 0, 0, 0, 0, 0, 0, 0, 0, 0, 0, 0, 0, 0, 0], dtype=int32) - surface_soil_heat_flux_3(time)float32dask.array<chunksize=(48,), meta=np.ndarray>
- long_name :
- Surface soil heat flux 3
- units :
- W/m^2
- resolution :
- 0.1
- ancillary_variables :
- qc_surface_soil_heat_flux_3
- history :
- act.qc.datafilter: Value is equal to missing_value. act.qc.datafilter: Value is less than the fail_min. act.qc.datafilter: Value is greater than the fail_max.
Array Chunk Bytes 1.12 kiB 192 B Shape (288,) (48,) Dask graph 6 chunks in 1 graph layer Data type float32 numpy.ndarray - qc_surface_soil_heat_flux_3(time)int320 0 0 0 0 0 0 0 ... 0 0 0 0 0 0 0 0
- long_name :
- Quality check results on field: Surface soil heat flux 3
- units :
- 1
- flag_masks :
- [1, 2, 4]
- flag_meanings :
- ['Value is equal to missing_value.', 'Value is less than the fail_min.', 'Value is greater than the fail_max.']
- flag_assessments :
- ['Bad', 'Bad', 'Bad']
- fail_min :
- -200.0
- fail_max :
- 100.0
- standard_name :
- quality_flag
array([0, 0, 0, 0, 0, 0, 0, 0, 0, 0, 0, 0, 0, 0, 0, 0, 0, 0, 0, 0, 0, 0, 0, 0, 0, 0, 0, 0, 0, 0, 0, 0, 0, 0, 0, 0, 0, 0, 0, 0, 0, 0, 0, 0, 0, 0, 0, 0, 0, 0, 0, 0, 0, 0, 0, 0, 0, 0, 0, 0, 0, 0, 0, 0, 0, 0, 0, 0, 0, 0, 0, 0, 0, 0, 0, 0, 0, 0, 0, 0, 0, 0, 0, 0, 0, 0, 0, 0, 0, 0, 0, 0, 0, 0, 0, 0, 0, 0, 0, 0, 0, 0, 0, 0, 0, 0, 0, 0, 0, 0, 0, 0, 0, 0, 0, 0, 0, 0, 0, 0, 0, 0, 0, 0, 0, 0, 0, 0, 0, 0, 0, 0, 0, 0, 0, 0, 0, 0, 0, 0, 0, 0, 0, 0, 0, 0, 0, 0, 0, 0, 0, 0, 0, 0, 0, 0, 0, 0, 0, 0, 0, 0, 0, 0, 0, 0, 0, 0, 0, 0, 0, 0, 0, 0, 0, 0, 0, 0, 0, 0, 0, 0, 0, 0, 0, 0, 0, 0, 0, 0, 0, 0, 0, 0, 0, 0, 0, 0, 0, 0, 0, 0, 0, 0, 0, 0, 0, 0, 0, 0, 0, 0, 0, 0, 0, 0, 0, 0, 0, 0, 0, 0, 0, 0, 0, 0, 0, 0, 0, 0, 0, 0, 0, 0, 0, 0, 0, 0, 0, 0, 0, 0, 0, 0, 0, 0, 0, 0, 0, 0, 0, 0, 0, 0, 0, 0, 0, 0, 0, 0, 0, 0, 0, 0, 0, 0, 0, 0, 0, 0, 0, 0, 0, 0, 0, 0, 0, 0, 0, 0, 0, 0, 0, 0, 0, 0, 0, 0], dtype=int32) - soil_moisture_1(time)float32dask.array<chunksize=(48,), meta=np.ndarray>
- long_name :
- Soil moisture 1, gravimetric
- units :
- %
- resolution :
- 0.1
- ancillary_variables :
- qc_soil_moisture_1
- history :
- act.qc.datafilter: Value is equal to missing_value. act.qc.datafilter: Value is less than the fail_min. act.qc.datafilter: Value is greater than the fail_max.
Array Chunk Bytes 1.12 kiB 192 B Shape (288,) (48,) Dask graph 6 chunks in 1 graph layer Data type float32 numpy.ndarray - qc_soil_moisture_1(time)int320 0 0 0 0 0 0 0 ... 0 0 0 0 0 0 0 0
- long_name :
- Quality check results on field: Soil moisture 1, gravimetric
- units :
- 1
- flag_masks :
- [1, 2, 4]
- flag_meanings :
- ['Value is equal to missing_value.', 'Value is less than the fail_min.', 'Value is greater than the fail_max.']
- flag_assessments :
- ['Bad', 'Bad', 'Bad']
- fail_min :
- 0.0
- fail_max :
- 50.0
- standard_name :
- quality_flag
array([0, 0, 0, 0, 0, 0, 0, 0, 0, 0, 0, 0, 0, 0, 0, 0, 0, 0, 0, 0, 0, 0, 0, 0, 0, 0, 0, 0, 0, 0, 0, 0, 0, 0, 0, 0, 0, 0, 0, 0, 0, 0, 0, 0, 0, 0, 0, 0, 0, 0, 0, 0, 0, 0, 0, 0, 0, 0, 0, 0, 0, 0, 0, 0, 0, 0, 0, 0, 0, 0, 0, 0, 0, 0, 0, 0, 0, 0, 0, 0, 0, 0, 0, 0, 0, 0, 0, 0, 0, 0, 0, 0, 0, 0, 0, 0, 0, 0, 0, 0, 0, 0, 0, 0, 0, 0, 0, 0, 0, 0, 0, 0, 0, 0, 0, 0, 0, 0, 0, 0, 0, 0, 0, 0, 0, 0, 0, 0, 0, 0, 0, 0, 0, 0, 0, 0, 0, 0, 0, 0, 0, 0, 0, 0, 0, 0, 0, 0, 0, 0, 0, 0, 0, 0, 0, 0, 0, 0, 0, 0, 0, 0, 0, 0, 0, 0, 0, 0, 0, 0, 0, 0, 0, 0, 0, 0, 0, 0, 0, 0, 0, 0, 0, 0, 0, 0, 0, 0, 0, 0, 0, 0, 0, 0, 0, 0, 0, 0, 0, 0, 0, 0, 0, 0, 0, 0, 0, 0, 0, 0, 0, 0, 0, 0, 0, 0, 0, 0, 0, 0, 0, 0, 0, 0, 0, 0, 0, 0, 0, 0, 0, 0, 0, 0, 0, 0, 0, 0, 0, 0, 0, 0, 0, 0, 0, 0, 0, 0, 0, 0, 0, 0, 0, 0, 0, 0, 0, 0, 0, 0, 0, 0, 0, 0, 0, 0, 0, 0, 0, 0, 0, 0, 0, 0, 0, 0, 0, 0, 0, 0, 0, 0, 0, 0, 0, 0, 0, 0], dtype=int32) - soil_moisture_2(time)float32dask.array<chunksize=(48,), meta=np.ndarray>
- long_name :
- Soil moisture 2, gravimetric
- units :
- %
- resolution :
- 0.1
- ancillary_variables :
- qc_soil_moisture_2
- history :
- act.qc.datafilter: Value is equal to missing_value. act.qc.datafilter: Value is less than the fail_min. act.qc.datafilter: Value is greater than the fail_max.
Array Chunk Bytes 1.12 kiB 192 B Shape (288,) (48,) Dask graph 6 chunks in 1 graph layer Data type float32 numpy.ndarray - qc_soil_moisture_2(time)int320 0 0 0 0 0 0 0 ... 0 0 0 0 0 0 0 0
- long_name :
- Quality check results on field: Soil moisture 2, gravimetric
- units :
- 1
- flag_masks :
- [1, 2, 4]
- flag_meanings :
- ['Value is equal to missing_value.', 'Value is less than the fail_min.', 'Value is greater than the fail_max.']
- flag_assessments :
- ['Bad', 'Bad', 'Bad']
- fail_min :
- 0.0
- fail_max :
- 50.0
- standard_name :
- quality_flag
array([0, 0, 0, 0, 0, 0, 0, 0, 0, 0, 0, 0, 0, 0, 0, 0, 0, 0, 0, 0, 0, 0, 0, 0, 0, 0, 0, 0, 0, 0, 0, 0, 0, 0, 0, 0, 0, 0, 0, 0, 0, 0, 0, 0, 0, 0, 0, 0, 0, 0, 0, 0, 0, 0, 0, 0, 0, 0, 0, 0, 0, 0, 0, 0, 0, 0, 0, 0, 0, 0, 0, 0, 0, 0, 0, 0, 0, 0, 0, 0, 0, 0, 0, 0, 0, 0, 0, 0, 0, 0, 0, 0, 0, 0, 0, 0, 0, 0, 0, 0, 0, 0, 0, 0, 0, 0, 0, 0, 0, 0, 0, 0, 0, 0, 0, 0, 0, 0, 0, 0, 0, 0, 0, 0, 0, 0, 0, 0, 0, 0, 0, 0, 0, 0, 0, 0, 0, 0, 0, 0, 0, 0, 0, 0, 0, 0, 0, 0, 0, 0, 0, 0, 0, 0, 0, 0, 0, 0, 0, 0, 0, 0, 0, 0, 0, 0, 0, 0, 0, 0, 0, 0, 0, 0, 0, 0, 0, 0, 0, 0, 0, 0, 0, 0, 0, 0, 0, 0, 0, 0, 0, 0, 0, 0, 0, 0, 0, 0, 0, 0, 0, 0, 0, 0, 0, 0, 0, 0, 0, 0, 0, 0, 0, 0, 0, 0, 0, 0, 0, 0, 0, 0, 0, 0, 0, 0, 0, 0, 0, 0, 0, 0, 0, 0, 0, 0, 0, 0, 0, 0, 0, 0, 0, 0, 0, 0, 0, 0, 0, 0, 0, 0, 0, 0, 0, 0, 0, 0, 0, 0, 0, 0, 0, 0, 0, 0, 0, 0, 0, 0, 0, 0, 0, 0, 0, 0, 0, 0, 0, 0, 0, 0, 0, 0, 0, 0, 0, 0], dtype=int32) - soil_moisture_3(time)float32dask.array<chunksize=(48,), meta=np.ndarray>
- long_name :
- Soil moisture 3, gravimetric
- units :
- %
- resolution :
- 0.1
- ancillary_variables :
- qc_soil_moisture_3
- history :
- act.qc.datafilter: Value is equal to missing_value. act.qc.datafilter: Value is less than the fail_min. act.qc.datafilter: Value is greater than the fail_max.
Array Chunk Bytes 1.12 kiB 192 B Shape (288,) (48,) Dask graph 6 chunks in 1 graph layer Data type float32 numpy.ndarray - qc_soil_moisture_3(time)int320 0 0 0 0 0 0 0 ... 0 0 0 0 0 0 0 0
- long_name :
- Quality check results on field: Soil moisture 3, gravimetric
- units :
- 1
- flag_masks :
- [1, 2, 4]
- flag_meanings :
- ['Value is equal to missing_value.', 'Value is less than the fail_min.', 'Value is greater than the fail_max.']
- flag_assessments :
- ['Bad', 'Bad', 'Bad']
- fail_min :
- 0.0
- fail_max :
- 50.0
- standard_name :
- quality_flag
array([0, 0, 0, 0, 0, 0, 0, 0, 0, 0, 0, 0, 0, 0, 0, 0, 0, 0, 0, 0, 0, 0, 0, 0, 0, 0, 0, 0, 0, 0, 0, 0, 0, 0, 0, 0, 0, 0, 0, 0, 0, 0, 0, 0, 0, 0, 0, 0, 0, 0, 0, 0, 0, 0, 0, 0, 0, 0, 0, 0, 0, 0, 0, 0, 0, 0, 0, 0, 0, 0, 0, 0, 0, 0, 0, 0, 0, 0, 0, 0, 0, 0, 0, 0, 0, 0, 0, 0, 0, 0, 0, 0, 0, 0, 0, 0, 0, 0, 0, 0, 0, 0, 0, 0, 0, 0, 0, 0, 0, 0, 0, 0, 0, 0, 0, 0, 0, 0, 0, 0, 0, 0, 0, 0, 0, 0, 0, 0, 0, 0, 0, 0, 0, 0, 0, 0, 0, 0, 0, 0, 0, 0, 0, 0, 0, 0, 0, 0, 0, 0, 0, 0, 0, 0, 0, 0, 0, 0, 0, 0, 0, 0, 0, 0, 0, 0, 0, 0, 0, 0, 0, 0, 0, 0, 0, 0, 0, 0, 0, 0, 0, 0, 0, 0, 0, 0, 0, 0, 0, 0, 0, 0, 0, 0, 0, 0, 0, 0, 0, 0, 0, 0, 0, 0, 0, 0, 0, 0, 0, 0, 0, 0, 0, 0, 0, 0, 0, 0, 0, 0, 0, 0, 0, 0, 0, 0, 0, 0, 0, 0, 0, 0, 0, 0, 0, 0, 0, 0, 0, 0, 0, 0, 0, 0, 0, 0, 0, 0, 0, 0, 0, 0, 0, 0, 0, 0, 0, 0, 0, 0, 0, 0, 0, 0, 0, 0, 0, 0, 0, 0, 0, 0, 0, 0, 0, 0, 0, 0, 0, 0, 0, 0, 0, 0, 0, 0, 0, 0], dtype=int32) - soil_temp_1(time)float32dask.array<chunksize=(48,), meta=np.ndarray>
- long_name :
- Soil temperature 1
- units :
- degC
- resolution :
- 0.1
- ancillary_variables :
- qc_soil_temp_1
- history :
- act.qc.datafilter: Value is equal to missing_value. act.qc.datafilter: Value is less than the fail_min. act.qc.datafilter: Value is greater than the fail_max.
Array Chunk Bytes 1.12 kiB 192 B Shape (288,) (48,) Dask graph 6 chunks in 1 graph layer Data type float32 numpy.ndarray - qc_soil_temp_1(time)int320 0 0 0 0 0 0 0 ... 0 0 0 0 0 0 0 0
- long_name :
- Quality check results on field: Soil temperature 1
- units :
- 1
- flag_masks :
- [1, 2, 4]
- flag_meanings :
- ['Value is equal to missing_value.', 'Value is less than the fail_min.', 'Value is greater than the fail_max.']
- flag_assessments :
- ['Bad', 'Bad', 'Bad']
- fail_min :
- -40.0
- fail_max :
- 50.0
- standard_name :
- quality_flag
array([0, 0, 0, 0, 0, 0, 0, 0, 0, 0, 0, 0, 0, 0, 0, 0, 0, 0, 0, 0, 0, 0, 0, 0, 0, 0, 0, 0, 0, 0, 0, 0, 0, 0, 0, 0, 0, 0, 0, 0, 0, 0, 0, 0, 0, 0, 0, 0, 0, 0, 0, 0, 0, 0, 0, 0, 0, 0, 0, 0, 0, 0, 0, 0, 0, 0, 0, 0, 0, 0, 0, 0, 0, 0, 0, 0, 0, 0, 0, 0, 0, 0, 0, 0, 0, 0, 0, 0, 0, 0, 0, 0, 0, 0, 0, 0, 0, 0, 0, 0, 0, 0, 0, 0, 0, 0, 0, 0, 0, 0, 0, 0, 0, 0, 0, 0, 0, 0, 0, 0, 0, 0, 0, 0, 0, 0, 0, 0, 0, 0, 0, 0, 0, 0, 0, 0, 0, 0, 0, 0, 0, 0, 0, 0, 0, 0, 0, 0, 0, 0, 0, 0, 0, 0, 0, 0, 0, 0, 0, 0, 0, 0, 0, 0, 0, 0, 0, 0, 0, 0, 0, 0, 0, 0, 0, 0, 0, 0, 0, 0, 0, 0, 0, 0, 0, 0, 0, 0, 0, 0, 0, 0, 0, 0, 0, 0, 0, 0, 0, 0, 0, 0, 0, 0, 0, 0, 0, 0, 0, 0, 0, 0, 0, 0, 0, 0, 0, 0, 0, 0, 0, 0, 0, 0, 0, 0, 0, 0, 0, 0, 0, 0, 0, 0, 0, 0, 0, 0, 0, 0, 0, 0, 0, 0, 0, 0, 0, 0, 0, 0, 0, 0, 0, 0, 0, 0, 0, 0, 0, 0, 0, 0, 0, 0, 0, 0, 0, 0, 0, 0, 0, 0, 0, 0, 0, 0, 0, 0, 0, 0, 0, 0, 0, 0, 0, 0, 0, 0], dtype=int32) - soil_temp_2(time)float32dask.array<chunksize=(48,), meta=np.ndarray>
- long_name :
- Soil temperature 2
- units :
- degC
- resolution :
- 0.1
- ancillary_variables :
- qc_soil_temp_2
- history :
- act.qc.datafilter: Value is equal to missing_value. act.qc.datafilter: Value is less than the fail_min. act.qc.datafilter: Value is greater than the fail_max.
Array Chunk Bytes 1.12 kiB 192 B Shape (288,) (48,) Dask graph 6 chunks in 1 graph layer Data type float32 numpy.ndarray - qc_soil_temp_2(time)int320 0 0 0 0 0 0 0 ... 0 0 0 0 0 0 0 0
- long_name :
- Quality check results on field: Soil temperature 2
- units :
- 1
- flag_masks :
- [1, 2, 4]
- flag_meanings :
- ['Value is equal to missing_value.', 'Value is less than the fail_min.', 'Value is greater than the fail_max.']
- flag_assessments :
- ['Bad', 'Bad', 'Bad']
- fail_min :
- -40.0
- fail_max :
- 50.0
- standard_name :
- quality_flag
array([0, 0, 0, 0, 0, 0, 0, 0, 0, 0, 0, 0, 0, 0, 0, 0, 0, 0, 0, 0, 0, 0, 0, 0, 0, 0, 0, 0, 0, 0, 0, 0, 0, 0, 0, 0, 0, 0, 0, 0, 0, 0, 0, 0, 0, 0, 0, 0, 0, 0, 0, 0, 0, 0, 0, 0, 0, 0, 0, 0, 0, 0, 0, 0, 0, 0, 0, 0, 0, 0, 0, 0, 0, 0, 0, 0, 0, 0, 0, 0, 0, 0, 0, 0, 0, 0, 0, 0, 0, 0, 0, 0, 0, 0, 0, 0, 0, 0, 0, 0, 0, 0, 0, 0, 0, 0, 0, 0, 0, 0, 0, 0, 0, 0, 0, 0, 0, 0, 0, 0, 0, 0, 0, 0, 0, 0, 0, 0, 0, 0, 0, 0, 0, 0, 0, 0, 0, 0, 0, 0, 0, 0, 0, 0, 0, 0, 0, 0, 0, 0, 0, 0, 0, 0, 0, 0, 0, 0, 0, 0, 0, 0, 0, 0, 0, 0, 0, 0, 0, 0, 0, 0, 0, 0, 0, 0, 0, 0, 0, 0, 0, 0, 0, 0, 0, 0, 0, 0, 0, 0, 0, 0, 0, 0, 0, 0, 0, 0, 0, 0, 0, 0, 0, 0, 0, 0, 0, 0, 0, 0, 0, 0, 0, 0, 0, 0, 0, 0, 0, 0, 0, 0, 0, 0, 0, 0, 0, 0, 0, 0, 0, 0, 0, 0, 0, 0, 0, 0, 0, 0, 0, 0, 0, 0, 0, 0, 0, 0, 0, 0, 0, 0, 0, 0, 0, 0, 0, 0, 0, 0, 0, 0, 0, 0, 0, 0, 0, 0, 0, 0, 0, 0, 0, 0, 0, 0, 0, 0, 0, 0, 0, 0, 0, 0, 0, 0, 0, 0], dtype=int32) - soil_temp_3(time)float32dask.array<chunksize=(48,), meta=np.ndarray>
- long_name :
- Soil temperature 3
- units :
- degC
- resolution :
- 0.1
- ancillary_variables :
- qc_soil_temp_3
- history :
- act.qc.datafilter: Value is equal to missing_value. act.qc.datafilter: Value is less than the fail_min. act.qc.datafilter: Value is greater than the fail_max.
Array Chunk Bytes 1.12 kiB 192 B Shape (288,) (48,) Dask graph 6 chunks in 1 graph layer Data type float32 numpy.ndarray - qc_soil_temp_3(time)int320 0 0 0 0 0 0 0 ... 0 0 0 0 0 0 0 0
- long_name :
- Quality check results on field: Soil temperature 3
- units :
- 1
- flag_masks :
- [1, 2, 4]
- flag_meanings :
- ['Value is equal to missing_value.', 'Value is less than the fail_min.', 'Value is greater than the fail_max.']
- flag_assessments :
- ['Bad', 'Bad', 'Bad']
- fail_min :
- -40.0
- fail_max :
- 50.0
- standard_name :
- quality_flag
array([0, 0, 0, 0, 0, 0, 0, 0, 0, 0, 0, 0, 0, 0, 0, 0, 0, 0, 0, 0, 0, 0, 0, 0, 0, 0, 0, 0, 0, 0, 0, 0, 0, 0, 0, 0, 0, 0, 0, 0, 0, 0, 0, 0, 0, 0, 0, 0, 0, 0, 0, 0, 0, 0, 0, 0, 0, 0, 0, 0, 0, 0, 0, 0, 0, 0, 0, 0, 0, 0, 0, 0, 0, 0, 0, 0, 0, 0, 0, 0, 0, 0, 0, 0, 0, 0, 0, 0, 0, 0, 0, 0, 0, 0, 0, 0, 0, 0, 0, 0, 0, 0, 0, 0, 0, 0, 0, 0, 0, 0, 0, 0, 0, 0, 0, 0, 0, 0, 0, 0, 0, 0, 0, 0, 0, 0, 0, 0, 0, 0, 0, 0, 0, 0, 0, 0, 0, 0, 0, 0, 0, 0, 0, 0, 0, 0, 0, 0, 0, 0, 0, 0, 0, 0, 0, 0, 0, 0, 0, 0, 0, 0, 0, 0, 0, 0, 0, 0, 0, 0, 0, 0, 0, 0, 0, 0, 0, 0, 0, 0, 0, 0, 0, 0, 0, 0, 0, 0, 0, 0, 0, 0, 0, 0, 0, 0, 0, 0, 0, 0, 0, 0, 0, 0, 0, 0, 0, 0, 0, 0, 0, 0, 0, 0, 0, 0, 0, 0, 0, 0, 0, 0, 0, 0, 0, 0, 0, 0, 0, 0, 0, 0, 0, 0, 0, 0, 0, 0, 0, 0, 0, 0, 0, 0, 0, 0, 0, 0, 0, 0, 0, 0, 0, 0, 0, 0, 0, 0, 0, 0, 0, 0, 0, 0, 0, 0, 0, 0, 0, 0, 0, 0, 0, 0, 0, 0, 0, 0, 0, 0, 0, 0, 0, 0, 0, 0, 0, 0], dtype=int32) - soil_heat_flow_1(time)float32dask.array<chunksize=(48,), meta=np.ndarray>
- long_name :
- Soil heat flow 1
- units :
- W/m^2
- resolution :
- 0.1
- ancillary_variables :
- qc_soil_heat_flow_1
- history :
- act.qc.datafilter: Value is equal to missing_value. act.qc.datafilter: Value is less than the fail_min. act.qc.datafilter: Value is greater than the fail_max.
Array Chunk Bytes 1.12 kiB 192 B Shape (288,) (48,) Dask graph 6 chunks in 1 graph layer Data type float32 numpy.ndarray - qc_soil_heat_flow_1(time)int320 0 0 0 0 0 0 0 ... 0 0 0 0 0 0 0 0
- long_name :
- Quality check results on field: Soil heat flow 1
- units :
- 1
- flag_masks :
- [1, 2, 4]
- flag_meanings :
- ['Value is equal to missing_value.', 'Value is less than the fail_min.', 'Value is greater than the fail_max.']
- flag_assessments :
- ['Bad', 'Bad', 'Bad']
- fail_min :
- -200.0
- fail_max :
- 100.0
- standard_name :
- quality_flag
array([0, 0, 0, 0, 0, 0, 0, 0, 0, 0, 0, 0, 0, 0, 0, 0, 0, 0, 0, 0, 0, 0, 0, 0, 0, 0, 0, 0, 0, 0, 0, 0, 0, 0, 0, 0, 0, 0, 0, 0, 0, 0, 0, 0, 0, 0, 0, 0, 0, 0, 0, 0, 0, 0, 0, 0, 0, 0, 0, 0, 0, 0, 0, 0, 0, 0, 0, 0, 0, 0, 0, 0, 0, 0, 0, 0, 0, 0, 0, 0, 0, 0, 0, 0, 0, 0, 0, 0, 0, 0, 0, 0, 0, 0, 0, 0, 0, 0, 0, 0, 0, 0, 0, 0, 0, 0, 0, 0, 0, 0, 0, 0, 0, 0, 0, 0, 0, 0, 0, 0, 0, 0, 0, 0, 0, 0, 0, 0, 0, 0, 0, 0, 0, 0, 0, 0, 0, 0, 0, 0, 0, 0, 0, 0, 0, 0, 0, 0, 0, 0, 0, 0, 0, 0, 0, 0, 0, 0, 0, 0, 0, 0, 0, 0, 0, 0, 0, 0, 0, 0, 0, 0, 0, 0, 0, 0, 0, 0, 0, 0, 0, 0, 0, 0, 0, 0, 0, 0, 0, 0, 0, 0, 0, 0, 0, 0, 0, 0, 0, 0, 0, 0, 0, 0, 0, 0, 0, 0, 0, 0, 0, 0, 0, 0, 0, 0, 0, 0, 0, 0, 0, 0, 0, 0, 0, 0, 0, 0, 0, 0, 0, 0, 0, 0, 0, 0, 0, 0, 0, 0, 0, 0, 0, 0, 0, 0, 0, 0, 0, 0, 0, 0, 0, 0, 0, 0, 0, 0, 0, 0, 0, 0, 0, 0, 0, 0, 0, 0, 0, 0, 0, 0, 0, 0, 0, 0, 0, 0, 0, 0, 0, 0, 0, 0, 0, 0, 0, 0], dtype=int32) - soil_heat_flow_2(time)float32dask.array<chunksize=(48,), meta=np.ndarray>
- long_name :
- Soil heat flow 2
- units :
- W/m^2
- resolution :
- 0.1
- ancillary_variables :
- qc_soil_heat_flow_2
- history :
- act.qc.datafilter: Value is equal to missing_value. act.qc.datafilter: Value is less than the fail_min. act.qc.datafilter: Value is greater than the fail_max.
Array Chunk Bytes 1.12 kiB 192 B Shape (288,) (48,) Dask graph 6 chunks in 1 graph layer Data type float32 numpy.ndarray - qc_soil_heat_flow_2(time)int320 0 0 0 0 0 0 0 ... 0 0 0 0 0 0 0 0
- long_name :
- Quality check results on field: Soil heat flow 2
- units :
- 1
- flag_masks :
- [1, 2, 4]
- flag_meanings :
- ['Value is equal to missing_value.', 'Value is less than the fail_min.', 'Value is greater than the fail_max.']
- flag_assessments :
- ['Bad', 'Bad', 'Bad']
- fail_min :
- -200.0
- fail_max :
- 100.0
- standard_name :
- quality_flag
array([0, 0, 0, 0, 0, 0, 0, 0, 0, 0, 0, 0, 0, 0, 0, 0, 0, 0, 0, 0, 0, 0, 0, 0, 0, 0, 0, 0, 0, 0, 0, 0, 0, 0, 0, 0, 0, 0, 0, 0, 0, 0, 0, 0, 0, 0, 0, 0, 0, 0, 0, 0, 0, 0, 0, 0, 0, 0, 0, 0, 0, 0, 0, 0, 0, 0, 0, 0, 0, 0, 0, 0, 0, 0, 0, 0, 0, 0, 0, 0, 0, 0, 0, 0, 0, 0, 0, 0, 0, 0, 0, 0, 0, 0, 0, 0, 0, 0, 0, 0, 0, 0, 0, 0, 0, 0, 0, 0, 0, 0, 0, 0, 0, 0, 0, 0, 0, 0, 0, 0, 0, 0, 0, 0, 0, 0, 0, 0, 0, 0, 0, 0, 0, 0, 0, 0, 0, 0, 0, 0, 0, 0, 0, 0, 0, 0, 0, 0, 0, 0, 0, 0, 0, 0, 0, 0, 0, 0, 0, 0, 0, 0, 0, 0, 0, 0, 0, 0, 0, 0, 0, 0, 0, 0, 0, 0, 0, 0, 0, 0, 0, 0, 0, 0, 0, 0, 0, 0, 0, 0, 0, 0, 0, 0, 0, 0, 0, 0, 0, 0, 0, 0, 0, 0, 0, 0, 0, 0, 0, 0, 0, 0, 0, 0, 0, 0, 0, 0, 0, 0, 0, 0, 0, 0, 0, 0, 0, 0, 0, 0, 0, 0, 0, 0, 0, 0, 0, 0, 0, 0, 0, 0, 0, 0, 0, 0, 0, 0, 0, 0, 0, 0, 0, 0, 0, 0, 0, 0, 0, 0, 0, 0, 0, 0, 0, 0, 0, 0, 0, 0, 0, 0, 0, 0, 0, 0, 0, 0, 0, 0, 0, 0, 0, 0, 0, 0, 0, 0], dtype=int32) - soil_heat_flow_3(time)float32dask.array<chunksize=(48,), meta=np.ndarray>
- long_name :
- Soil heat flow 3
- units :
- W/m^2
- resolution :
- 0.1
- ancillary_variables :
- qc_soil_heat_flow_3
- history :
- act.qc.datafilter: Value is equal to missing_value. act.qc.datafilter: Value is less than the fail_min. act.qc.datafilter: Value is greater than the fail_max.
Array Chunk Bytes 1.12 kiB 192 B Shape (288,) (48,) Dask graph 6 chunks in 1 graph layer Data type float32 numpy.ndarray - qc_soil_heat_flow_3(time)int320 0 0 0 0 0 0 0 ... 0 0 0 0 0 0 0 0
- long_name :
- Quality check results on field: Soil heat flow 3
- units :
- 1
- flag_masks :
- [1, 2, 4]
- flag_meanings :
- ['Value is equal to missing_value.', 'Value is less than the fail_min.', 'Value is greater than the fail_max.']
- flag_assessments :
- ['Bad', 'Bad', 'Bad']
- fail_min :
- -200.0
- fail_max :
- 100.0
- standard_name :
- quality_flag
array([0, 0, 0, 0, 0, 0, 0, 0, 0, 0, 0, 0, 0, 0, 0, 0, 0, 0, 0, 0, 0, 0, 0, 0, 0, 0, 0, 0, 0, 0, 0, 0, 0, 0, 0, 0, 0, 0, 0, 0, 0, 0, 0, 0, 0, 0, 0, 0, 0, 0, 0, 0, 0, 0, 0, 0, 0, 0, 0, 0, 0, 0, 0, 0, 0, 0, 0, 0, 0, 0, 0, 0, 0, 0, 0, 0, 0, 0, 0, 0, 0, 0, 0, 0, 0, 0, 0, 0, 0, 0, 0, 0, 0, 0, 0, 0, 0, 0, 0, 0, 0, 0, 0, 0, 0, 0, 0, 0, 0, 0, 0, 0, 0, 0, 0, 0, 0, 0, 0, 0, 0, 0, 0, 0, 0, 0, 0, 0, 0, 0, 0, 0, 0, 0, 0, 0, 0, 0, 0, 0, 0, 0, 0, 0, 0, 0, 0, 0, 0, 0, 0, 0, 0, 0, 0, 0, 0, 0, 0, 0, 0, 0, 0, 0, 0, 0, 0, 0, 0, 0, 0, 0, 0, 0, 0, 0, 0, 0, 0, 0, 0, 0, 0, 0, 0, 0, 0, 0, 0, 0, 0, 0, 0, 0, 0, 0, 0, 0, 0, 0, 0, 0, 0, 0, 0, 0, 0, 0, 0, 0, 0, 0, 0, 0, 0, 0, 0, 0, 0, 0, 0, 0, 0, 0, 0, 0, 0, 0, 0, 0, 0, 0, 0, 0, 0, 0, 0, 0, 0, 0, 0, 0, 0, 0, 0, 0, 0, 0, 0, 0, 0, 0, 0, 0, 0, 0, 0, 0, 0, 0, 0, 0, 0, 0, 0, 0, 0, 0, 0, 0, 0, 0, 0, 0, 0, 0, 0, 0, 0, 0, 0, 0, 0, 0, 0, 0, 0, 0], dtype=int32) - corr_soil_heat_flow_1(time)float32dask.array<chunksize=(48,), meta=np.ndarray>
- long_name :
- Soil heat flow 1, corrected for soil moisture
- units :
- W/m^2
- resolution :
- 0.1
- ancillary_variables :
- qc_corr_soil_heat_flow_1
- history :
- act.qc.datafilter: Value is equal to missing_value.
Array Chunk Bytes 1.12 kiB 192 B Shape (288,) (48,) Dask graph 6 chunks in 1 graph layer Data type float32 numpy.ndarray - qc_corr_soil_heat_flow_1(time)int320 0 0 0 0 0 0 0 ... 0 0 0 0 0 0 0 0
- long_name :
- Quality check results on field: Soil heat flow 1, corrected for soil moisture
- units :
- 1
- flag_masks :
- [1]
- flag_meanings :
- ['Value is equal to missing_value.']
- flag_assessments :
- ['Bad']
- standard_name :
- quality_flag
array([0, 0, 0, 0, 0, 0, 0, 0, 0, 0, 0, 0, 0, 0, 0, 0, 0, 0, 0, 0, 0, 0, 0, 0, 0, 0, 0, 0, 0, 0, 0, 0, 0, 0, 0, 0, 0, 0, 0, 0, 0, 0, 0, 0, 0, 0, 0, 0, 0, 0, 0, 0, 0, 0, 0, 0, 0, 0, 0, 0, 0, 0, 0, 0, 0, 0, 0, 0, 0, 0, 0, 0, 0, 0, 0, 0, 0, 0, 0, 0, 0, 0, 0, 0, 0, 0, 0, 0, 0, 0, 0, 0, 0, 0, 0, 0, 0, 0, 0, 0, 0, 0, 0, 0, 0, 0, 0, 0, 0, 0, 0, 0, 0, 0, 0, 0, 0, 0, 0, 0, 0, 0, 0, 0, 0, 0, 0, 0, 0, 0, 0, 0, 0, 0, 0, 0, 0, 0, 0, 0, 0, 0, 0, 0, 0, 0, 0, 0, 0, 0, 0, 0, 0, 0, 0, 0, 0, 0, 0, 0, 0, 0, 0, 0, 0, 0, 0, 0, 0, 0, 0, 0, 0, 0, 0, 0, 0, 0, 0, 0, 0, 0, 0, 0, 0, 0, 0, 0, 0, 0, 0, 0, 0, 0, 0, 0, 0, 0, 0, 0, 0, 0, 0, 0, 0, 0, 0, 0, 0, 0, 0, 0, 0, 0, 0, 0, 0, 0, 0, 0, 0, 0, 0, 0, 0, 0, 0, 0, 0, 0, 0, 0, 0, 0, 0, 0, 0, 0, 0, 0, 0, 0, 0, 0, 0, 0, 0, 0, 0, 0, 0, 0, 0, 0, 0, 0, 0, 0, 0, 0, 0, 0, 0, 0, 0, 0, 0, 0, 0, 0, 0, 0, 0, 0, 0, 0, 0, 0, 0, 0, 0, 0, 0, 0, 0, 0, 0, 0], dtype=int32) - corr_soil_heat_flow_2(time)float32dask.array<chunksize=(48,), meta=np.ndarray>
- long_name :
- Soil heat flow 2, corrected for soil moisture
- units :
- W/m^2
- resolution :
- 0.1
- ancillary_variables :
- qc_corr_soil_heat_flow_2
- history :
- act.qc.datafilter: Value is equal to missing_value.
Array Chunk Bytes 1.12 kiB 192 B Shape (288,) (48,) Dask graph 6 chunks in 1 graph layer Data type float32 numpy.ndarray - qc_corr_soil_heat_flow_2(time)int320 0 0 0 0 0 0 0 ... 0 0 0 0 0 0 0 0
- long_name :
- Quality check results on field: Soil heat flow 2, corrected for soil moisture
- units :
- 1
- flag_masks :
- [1]
- flag_meanings :
- ['Value is equal to missing_value.']
- flag_assessments :
- ['Bad']
- standard_name :
- quality_flag
array([0, 0, 0, 0, 0, 0, 0, 0, 0, 0, 0, 0, 0, 0, 0, 0, 0, 0, 0, 0, 0, 0, 0, 0, 0, 0, 0, 0, 0, 0, 0, 0, 0, 0, 0, 0, 0, 0, 0, 0, 0, 0, 0, 0, 0, 0, 0, 0, 0, 0, 0, 0, 0, 0, 0, 0, 0, 0, 0, 0, 0, 0, 0, 0, 0, 0, 0, 0, 0, 0, 0, 0, 0, 0, 0, 0, 0, 0, 0, 0, 0, 0, 0, 0, 0, 0, 0, 0, 0, 0, 0, 0, 0, 0, 0, 0, 0, 0, 0, 0, 0, 0, 0, 0, 0, 0, 0, 0, 0, 0, 0, 0, 0, 0, 0, 0, 0, 0, 0, 0, 0, 0, 0, 0, 0, 0, 0, 0, 0, 0, 0, 0, 0, 0, 0, 0, 0, 0, 0, 0, 0, 0, 0, 0, 0, 0, 0, 0, 0, 0, 0, 0, 0, 0, 0, 0, 0, 0, 0, 0, 0, 0, 0, 0, 0, 0, 0, 0, 0, 0, 0, 0, 0, 0, 0, 0, 0, 0, 0, 0, 0, 0, 0, 0, 0, 0, 0, 0, 0, 0, 0, 0, 0, 0, 0, 0, 0, 0, 0, 0, 0, 0, 0, 0, 0, 0, 0, 0, 0, 0, 0, 0, 0, 0, 0, 0, 0, 0, 0, 0, 0, 0, 0, 0, 0, 0, 0, 0, 0, 0, 0, 0, 0, 0, 0, 0, 0, 0, 0, 0, 0, 0, 0, 0, 0, 0, 0, 0, 0, 0, 0, 0, 0, 0, 0, 0, 0, 0, 0, 0, 0, 0, 0, 0, 0, 0, 0, 0, 0, 0, 0, 0, 0, 0, 0, 0, 0, 0, 0, 0, 0, 0, 0, 0, 0, 0, 0, 0], dtype=int32) - corr_soil_heat_flow_3(time)float32dask.array<chunksize=(48,), meta=np.ndarray>
- long_name :
- Soil heat flow 3, corrected for soil moisture
- units :
- W/m^2
- resolution :
- 0.1
- ancillary_variables :
- qc_corr_soil_heat_flow_3
- history :
- act.qc.datafilter: Value is equal to missing_value.
Array Chunk Bytes 1.12 kiB 192 B Shape (288,) (48,) Dask graph 6 chunks in 1 graph layer Data type float32 numpy.ndarray - qc_corr_soil_heat_flow_3(time)int320 0 0 0 0 0 0 0 ... 0 0 0 0 0 0 0 0
- long_name :
- Quality check results on field: Soil heat flow 3, corrected for soil moisture
- units :
- 1
- flag_masks :
- [1]
- flag_meanings :
- ['Value is equal to missing_value.']
- flag_assessments :
- ['Bad']
- standard_name :
- quality_flag
array([0, 0, 0, 0, 0, 0, 0, 0, 0, 0, 0, 0, 0, 0, 0, 0, 0, 0, 0, 0, 0, 0, 0, 0, 0, 0, 0, 0, 0, 0, 0, 0, 0, 0, 0, 0, 0, 0, 0, 0, 0, 0, 0, 0, 0, 0, 0, 0, 0, 0, 0, 0, 0, 0, 0, 0, 0, 0, 0, 0, 0, 0, 0, 0, 0, 0, 0, 0, 0, 0, 0, 0, 0, 0, 0, 0, 0, 0, 0, 0, 0, 0, 0, 0, 0, 0, 0, 0, 0, 0, 0, 0, 0, 0, 0, 0, 0, 0, 0, 0, 0, 0, 0, 0, 0, 0, 0, 0, 0, 0, 0, 0, 0, 0, 0, 0, 0, 0, 0, 0, 0, 0, 0, 0, 0, 0, 0, 0, 0, 0, 0, 0, 0, 0, 0, 0, 0, 0, 0, 0, 0, 0, 0, 0, 0, 0, 0, 0, 0, 0, 0, 0, 0, 0, 0, 0, 0, 0, 0, 0, 0, 0, 0, 0, 0, 0, 0, 0, 0, 0, 0, 0, 0, 0, 0, 0, 0, 0, 0, 0, 0, 0, 0, 0, 0, 0, 0, 0, 0, 0, 0, 0, 0, 0, 0, 0, 0, 0, 0, 0, 0, 0, 0, 0, 0, 0, 0, 0, 0, 0, 0, 0, 0, 0, 0, 0, 0, 0, 0, 0, 0, 0, 0, 0, 0, 0, 0, 0, 0, 0, 0, 0, 0, 0, 0, 0, 0, 0, 0, 0, 0, 0, 0, 0, 0, 0, 0, 0, 0, 0, 0, 0, 0, 0, 0, 0, 0, 0, 0, 0, 0, 0, 0, 0, 0, 0, 0, 0, 0, 0, 0, 0, 0, 0, 0, 0, 0, 0, 0, 0, 0, 0, 0, 0, 0, 0, 0, 0], dtype=int32) - soil_heat_capacity_1(time)float32dask.array<chunksize=(48,), meta=np.ndarray>
- long_name :
- Soil heat capacity 1
- units :
- MJ/m^3/degC
- resolution :
- 0.1
- ancillary_variables :
- qc_soil_heat_capacity_1
- history :
- act.qc.datafilter: Value is equal to missing_value.
Array Chunk Bytes 1.12 kiB 192 B Shape (288,) (48,) Dask graph 6 chunks in 1 graph layer Data type float32 numpy.ndarray - qc_soil_heat_capacity_1(time)int320 0 0 0 0 0 0 0 ... 0 0 0 0 0 0 0 0
- long_name :
- Quality check results on field: Soil heat capacity 1
- units :
- 1
- flag_masks :
- [1]
- flag_meanings :
- ['Value is equal to missing_value.']
- flag_assessments :
- ['Bad']
- standard_name :
- quality_flag
array([0, 0, 0, 0, 0, 0, 0, 0, 0, 0, 0, 0, 0, 0, 0, 0, 0, 0, 0, 0, 0, 0, 0, 0, 0, 0, 0, 0, 0, 0, 0, 0, 0, 0, 0, 0, 0, 0, 0, 0, 0, 0, 0, 0, 0, 0, 0, 0, 0, 0, 0, 0, 0, 0, 0, 0, 0, 0, 0, 0, 0, 0, 0, 0, 0, 0, 0, 0, 0, 0, 0, 0, 0, 0, 0, 0, 0, 0, 0, 0, 0, 0, 0, 0, 0, 0, 0, 0, 0, 0, 0, 0, 0, 0, 0, 0, 0, 0, 0, 0, 0, 0, 0, 0, 0, 0, 0, 0, 0, 0, 0, 0, 0, 0, 0, 0, 0, 0, 0, 0, 0, 0, 0, 0, 0, 0, 0, 0, 0, 0, 0, 0, 0, 0, 0, 0, 0, 0, 0, 0, 0, 0, 0, 0, 0, 0, 0, 0, 0, 0, 0, 0, 0, 0, 0, 0, 0, 0, 0, 0, 0, 0, 0, 0, 0, 0, 0, 0, 0, 0, 0, 0, 0, 0, 0, 0, 0, 0, 0, 0, 0, 0, 0, 0, 0, 0, 0, 0, 0, 0, 0, 0, 0, 0, 0, 0, 0, 0, 0, 0, 0, 0, 0, 0, 0, 0, 0, 0, 0, 0, 0, 0, 0, 0, 0, 0, 0, 0, 0, 0, 0, 0, 0, 0, 0, 0, 0, 0, 0, 0, 0, 0, 0, 0, 0, 0, 0, 0, 0, 0, 0, 0, 0, 0, 0, 0, 0, 0, 0, 0, 0, 0, 0, 0, 0, 0, 0, 0, 0, 0, 0, 0, 0, 0, 0, 0, 0, 0, 0, 0, 0, 0, 0, 0, 0, 0, 0, 0, 0, 0, 0, 0, 0, 0, 0, 0, 0, 0], dtype=int32) - soil_heat_capacity_2(time)float32dask.array<chunksize=(48,), meta=np.ndarray>
- long_name :
- Soil heat capacity 2
- units :
- MJ/m^3/degC
- resolution :
- 0.1
- ancillary_variables :
- qc_soil_heat_capacity_2
- history :
- act.qc.datafilter: Value is equal to missing_value.
Array Chunk Bytes 1.12 kiB 192 B Shape (288,) (48,) Dask graph 6 chunks in 1 graph layer Data type float32 numpy.ndarray - qc_soil_heat_capacity_2(time)int320 0 0 0 0 0 0 0 ... 0 0 0 0 0 0 0 0
- long_name :
- Quality check results on field: Soil heat capacity 2
- units :
- 1
- flag_masks :
- [1]
- flag_meanings :
- ['Value is equal to missing_value.']
- flag_assessments :
- ['Bad']
- standard_name :
- quality_flag
array([0, 0, 0, 0, 0, 0, 0, 0, 0, 0, 0, 0, 0, 0, 0, 0, 0, 0, 0, 0, 0, 0, 0, 0, 0, 0, 0, 0, 0, 0, 0, 0, 0, 0, 0, 0, 0, 0, 0, 0, 0, 0, 0, 0, 0, 0, 0, 0, 0, 0, 0, 0, 0, 0, 0, 0, 0, 0, 0, 0, 0, 0, 0, 0, 0, 0, 0, 0, 0, 0, 0, 0, 0, 0, 0, 0, 0, 0, 0, 0, 0, 0, 0, 0, 0, 0, 0, 0, 0, 0, 0, 0, 0, 0, 0, 0, 0, 0, 0, 0, 0, 0, 0, 0, 0, 0, 0, 0, 0, 0, 0, 0, 0, 0, 0, 0, 0, 0, 0, 0, 0, 0, 0, 0, 0, 0, 0, 0, 0, 0, 0, 0, 0, 0, 0, 0, 0, 0, 0, 0, 0, 0, 0, 0, 0, 0, 0, 0, 0, 0, 0, 0, 0, 0, 0, 0, 0, 0, 0, 0, 0, 0, 0, 0, 0, 0, 0, 0, 0, 0, 0, 0, 0, 0, 0, 0, 0, 0, 0, 0, 0, 0, 0, 0, 0, 0, 0, 0, 0, 0, 0, 0, 0, 0, 0, 0, 0, 0, 0, 0, 0, 0, 0, 0, 0, 0, 0, 0, 0, 0, 0, 0, 0, 0, 0, 0, 0, 0, 0, 0, 0, 0, 0, 0, 0, 0, 0, 0, 0, 0, 0, 0, 0, 0, 0, 0, 0, 0, 0, 0, 0, 0, 0, 0, 0, 0, 0, 0, 0, 0, 0, 0, 0, 0, 0, 0, 0, 0, 0, 0, 0, 0, 0, 0, 0, 0, 0, 0, 0, 0, 0, 0, 0, 0, 0, 0, 0, 0, 0, 0, 0, 0, 0, 0, 0, 0, 0, 0], dtype=int32) - soil_heat_capacity_3(time)float32dask.array<chunksize=(48,), meta=np.ndarray>
- long_name :
- Soil heat capacity 3
- units :
- MJ/m^3/degC
- resolution :
- 0.1
- ancillary_variables :
- qc_soil_heat_capacity_3
- history :
- act.qc.datafilter: Value is equal to missing_value.
Array Chunk Bytes 1.12 kiB 192 B Shape (288,) (48,) Dask graph 6 chunks in 1 graph layer Data type float32 numpy.ndarray - qc_soil_heat_capacity_3(time)int320 0 0 0 0 0 0 0 ... 0 0 0 0 0 0 0 0
- long_name :
- Quality check results on field: Soil heat capacity 3
- units :
- 1
- flag_masks :
- [1]
- flag_meanings :
- ['Value is equal to missing_value.']
- flag_assessments :
- ['Bad']
- standard_name :
- quality_flag
array([0, 0, 0, 0, 0, 0, 0, 0, 0, 0, 0, 0, 0, 0, 0, 0, 0, 0, 0, 0, 0, 0, 0, 0, 0, 0, 0, 0, 0, 0, 0, 0, 0, 0, 0, 0, 0, 0, 0, 0, 0, 0, 0, 0, 0, 0, 0, 0, 0, 0, 0, 0, 0, 0, 0, 0, 0, 0, 0, 0, 0, 0, 0, 0, 0, 0, 0, 0, 0, 0, 0, 0, 0, 0, 0, 0, 0, 0, 0, 0, 0, 0, 0, 0, 0, 0, 0, 0, 0, 0, 0, 0, 0, 0, 0, 0, 0, 0, 0, 0, 0, 0, 0, 0, 0, 0, 0, 0, 0, 0, 0, 0, 0, 0, 0, 0, 0, 0, 0, 0, 0, 0, 0, 0, 0, 0, 0, 0, 0, 0, 0, 0, 0, 0, 0, 0, 0, 0, 0, 0, 0, 0, 0, 0, 0, 0, 0, 0, 0, 0, 0, 0, 0, 0, 0, 0, 0, 0, 0, 0, 0, 0, 0, 0, 0, 0, 0, 0, 0, 0, 0, 0, 0, 0, 0, 0, 0, 0, 0, 0, 0, 0, 0, 0, 0, 0, 0, 0, 0, 0, 0, 0, 0, 0, 0, 0, 0, 0, 0, 0, 0, 0, 0, 0, 0, 0, 0, 0, 0, 0, 0, 0, 0, 0, 0, 0, 0, 0, 0, 0, 0, 0, 0, 0, 0, 0, 0, 0, 0, 0, 0, 0, 0, 0, 0, 0, 0, 0, 0, 0, 0, 0, 0, 0, 0, 0, 0, 0, 0, 0, 0, 0, 0, 0, 0, 0, 0, 0, 0, 0, 0, 0, 0, 0, 0, 0, 0, 0, 0, 0, 0, 0, 0, 0, 0, 0, 0, 0, 0, 0, 0, 0, 0, 0, 0, 0, 0, 0], dtype=int32) - energy_storage_change_1(time)float32dask.array<chunksize=(48,), meta=np.ndarray>
- long_name :
- Change in energy storage 1, 0-5 cm soil layer
- units :
- W/m^2
- resolution :
- 0.1
- ancillary_variables :
- qc_energy_storage_change_1
- history :
- act.qc.datafilter: Value is equal to missing_value.
Array Chunk Bytes 1.12 kiB 192 B Shape (288,) (48,) Dask graph 6 chunks in 1 graph layer Data type float32 numpy.ndarray - qc_energy_storage_change_1(time)int320 0 0 0 0 0 0 0 ... 0 0 0 0 0 0 0 0
- long_name :
- Quality check results on field: Change in energy storage 1, 0-5 cm soil layer
- units :
- 1
- flag_masks :
- [1]
- flag_meanings :
- ['Value is equal to missing_value.']
- flag_assessments :
- ['Bad']
- standard_name :
- quality_flag
array([0, 0, 0, 0, 0, 0, 0, 0, 0, 0, 0, 0, 0, 0, 0, 0, 0, 0, 0, 0, 0, 0, 0, 0, 0, 0, 0, 0, 0, 0, 0, 0, 0, 0, 0, 0, 0, 0, 0, 0, 0, 0, 0, 0, 0, 0, 0, 0, 0, 0, 0, 0, 0, 0, 0, 0, 0, 0, 0, 0, 0, 0, 0, 0, 0, 0, 0, 0, 0, 0, 0, 0, 0, 0, 0, 0, 0, 0, 0, 0, 0, 0, 0, 0, 0, 0, 0, 0, 0, 0, 0, 0, 0, 0, 0, 0, 0, 0, 0, 0, 0, 0, 0, 0, 0, 0, 0, 0, 0, 0, 0, 0, 0, 0, 0, 0, 0, 0, 0, 0, 0, 0, 0, 0, 0, 0, 0, 0, 0, 0, 0, 0, 0, 0, 0, 0, 0, 0, 0, 0, 0, 0, 0, 0, 0, 0, 0, 0, 0, 0, 0, 0, 0, 0, 0, 0, 0, 0, 0, 0, 0, 0, 0, 0, 0, 0, 0, 0, 0, 0, 0, 0, 0, 0, 0, 0, 0, 0, 0, 0, 0, 0, 0, 0, 0, 0, 0, 0, 0, 0, 0, 0, 0, 0, 0, 0, 0, 0, 0, 0, 0, 0, 0, 0, 0, 0, 0, 0, 0, 0, 0, 0, 0, 0, 0, 0, 0, 0, 0, 0, 0, 0, 0, 0, 0, 0, 0, 0, 0, 0, 0, 0, 0, 0, 0, 0, 0, 0, 0, 0, 0, 0, 0, 0, 0, 0, 0, 0, 0, 0, 0, 0, 0, 0, 0, 0, 0, 0, 0, 0, 0, 0, 0, 0, 0, 0, 0, 0, 0, 0, 0, 0, 0, 0, 0, 0, 0, 0, 0, 0, 0, 0, 0, 0, 0, 0, 0, 0], dtype=int32) - energy_storage_change_2(time)float32dask.array<chunksize=(48,), meta=np.ndarray>
- long_name :
- Change in energy storage 2, 0-5 cm soil layer
- units :
- W/m^2
- resolution :
- 0.1
- ancillary_variables :
- qc_energy_storage_change_2
- history :
- act.qc.datafilter: Value is equal to missing_value.
Array Chunk Bytes 1.12 kiB 192 B Shape (288,) (48,) Dask graph 6 chunks in 1 graph layer Data type float32 numpy.ndarray - qc_energy_storage_change_2(time)int320 0 0 0 0 0 0 0 ... 0 0 0 0 0 0 0 0
- long_name :
- Quality check results on field: Change in energy storage 2, 0-5 cm soil layer
- units :
- 1
- flag_masks :
- [1]
- flag_meanings :
- ['Value is equal to missing_value.']
- flag_assessments :
- ['Bad']
- standard_name :
- quality_flag
array([0, 0, 0, 0, 0, 0, 0, 0, 0, 0, 0, 0, 0, 0, 0, 0, 0, 0, 0, 0, 0, 0, 0, 0, 0, 0, 0, 0, 0, 0, 0, 0, 0, 0, 0, 0, 0, 0, 0, 0, 0, 0, 0, 0, 0, 0, 0, 0, 0, 0, 0, 0, 0, 0, 0, 0, 0, 0, 0, 0, 0, 0, 0, 0, 0, 0, 0, 0, 0, 0, 0, 0, 0, 0, 0, 0, 0, 0, 0, 0, 0, 0, 0, 0, 0, 0, 0, 0, 0, 0, 0, 0, 0, 0, 0, 0, 0, 0, 0, 0, 0, 0, 0, 0, 0, 0, 0, 0, 0, 0, 0, 0, 0, 0, 0, 0, 0, 0, 0, 0, 0, 0, 0, 0, 0, 0, 0, 0, 0, 0, 0, 0, 0, 0, 0, 0, 0, 0, 0, 0, 0, 0, 0, 0, 0, 0, 0, 0, 0, 0, 0, 0, 0, 0, 0, 0, 0, 0, 0, 0, 0, 0, 0, 0, 0, 0, 0, 0, 0, 0, 0, 0, 0, 0, 0, 0, 0, 0, 0, 0, 0, 0, 0, 0, 0, 0, 0, 0, 0, 0, 0, 0, 0, 0, 0, 0, 0, 0, 0, 0, 0, 0, 0, 0, 0, 0, 0, 0, 0, 0, 0, 0, 0, 0, 0, 0, 0, 0, 0, 0, 0, 0, 0, 0, 0, 0, 0, 0, 0, 0, 0, 0, 0, 0, 0, 0, 0, 0, 0, 0, 0, 0, 0, 0, 0, 0, 0, 0, 0, 0, 0, 0, 0, 0, 0, 0, 0, 0, 0, 0, 0, 0, 0, 0, 0, 0, 0, 0, 0, 0, 0, 0, 0, 0, 0, 0, 0, 0, 0, 0, 0, 0, 0, 0, 0, 0, 0, 0], dtype=int32) - energy_storage_change_3(time)float32dask.array<chunksize=(48,), meta=np.ndarray>
- long_name :
- Change in energy storage 3, 0-5 cm soil layer
- units :
- W/m^2
- resolution :
- 0.1
- ancillary_variables :
- qc_energy_storage_change_3
- history :
- act.qc.datafilter: Value is equal to missing_value.
Array Chunk Bytes 1.12 kiB 192 B Shape (288,) (48,) Dask graph 6 chunks in 1 graph layer Data type float32 numpy.ndarray - qc_energy_storage_change_3(time)int320 0 0 0 0 0 0 0 ... 0 0 0 0 0 0 0 0
- long_name :
- Quality check results on field: Change in energy storage 3, 0-5 cm soil layer
- units :
- 1
- flag_masks :
- [1]
- flag_meanings :
- ['Value is equal to missing_value.']
- flag_assessments :
- ['Bad']
- standard_name :
- quality_flag
array([0, 0, 0, 0, 0, 0, 0, 0, 0, 0, 0, 0, 0, 0, 0, 0, 0, 0, 0, 0, 0, 0, 0, 0, 0, 0, 0, 0, 0, 0, 0, 0, 0, 0, 0, 0, 0, 0, 0, 0, 0, 0, 0, 0, 0, 0, 0, 0, 0, 0, 0, 0, 0, 0, 0, 0, 0, 0, 0, 0, 0, 0, 0, 0, 0, 0, 0, 0, 0, 0, 0, 0, 0, 0, 0, 0, 0, 0, 0, 0, 0, 0, 0, 0, 0, 0, 0, 0, 0, 0, 0, 0, 0, 0, 0, 0, 0, 0, 0, 0, 0, 0, 0, 0, 0, 0, 0, 0, 0, 0, 0, 0, 0, 0, 0, 0, 0, 0, 0, 0, 0, 0, 0, 0, 0, 0, 0, 0, 0, 0, 0, 0, 0, 0, 0, 0, 0, 0, 0, 0, 0, 0, 0, 0, 0, 0, 0, 0, 0, 0, 0, 0, 0, 0, 0, 0, 0, 0, 0, 0, 0, 0, 0, 0, 0, 0, 0, 0, 0, 0, 0, 0, 0, 0, 0, 0, 0, 0, 0, 0, 0, 0, 0, 0, 0, 0, 0, 0, 0, 0, 0, 0, 0, 0, 0, 0, 0, 0, 0, 0, 0, 0, 0, 0, 0, 0, 0, 0, 0, 0, 0, 0, 0, 0, 0, 0, 0, 0, 0, 0, 0, 0, 0, 0, 0, 0, 0, 0, 0, 0, 0, 0, 0, 0, 0, 0, 0, 0, 0, 0, 0, 0, 0, 0, 0, 0, 0, 0, 0, 0, 0, 0, 0, 0, 0, 0, 0, 0, 0, 0, 0, 0, 0, 0, 0, 0, 0, 0, 0, 0, 0, 0, 0, 0, 0, 0, 0, 0, 0, 0, 0, 0, 0, 0, 0, 0, 0, 0], dtype=int32) - albedo(time)float32dask.array<chunksize=(48,), meta=np.ndarray>
- long_name :
- Albedo
- units :
- fraction
- resolution :
- 0.01
- ancillary_variables :
- qc_albedo
- history :
- act.qc.datafilter: Value is equal to missing_value. act.qc.datafilter: Value is less than the fail_min. act.qc.datafilter: Value is greater than the fail_max.
Array Chunk Bytes 1.12 kiB 192 B Shape (288,) (48,) Dask graph 6 chunks in 1 graph layer Data type float32 numpy.ndarray - qc_albedo(time)int324 0 0 0 0 0 0 0 ... 4 4 4 4 4 4 4 4
- long_name :
- Quality check results on field: Albedo
- units :
- 1
- flag_masks :
- [1, 2, 4]
- flag_meanings :
- ['Value is equal to missing_value.', 'Value is less than the fail_min.', 'Value is greater than the fail_max.']
- flag_assessments :
- ['Bad', 'Bad', 'Bad']
- fail_min :
- 0.0
- fail_max :
- 1.0
- standard_name :
- quality_flag
array([4, 0, 0, 0, 0, 0, 0, 0, 0, 0, 0, 0, 0, 0, 0, 0, 0, 0, 0, 0, 0, 0, 0, 0, 0, 0, 0, 0, 0, 2, 4, 0, 0, 0, 0, 4, 4, 4, 4, 4, 4, 4, 4, 4, 4, 4, 4, 4, 4, 0, 0, 0, 0, 0, 0, 0, 0, 0, 0, 0, 0, 0, 0, 0, 0, 0, 0, 0, 0, 0, 0, 0, 0, 0, 0, 0, 0, 0, 4, 0, 0, 0, 0, 0, 0, 0, 0, 4, 4, 4, 4, 4, 4, 4, 4, 4, 4, 0, 0, 0, 0, 0, 0, 0, 0, 0, 4, 0, 0, 0, 0, 0, 0, 0, 0, 0, 0, 0, 0, 0, 0, 0, 0, 0, 0, 0, 4, 4, 4, 4, 4, 4, 4, 4, 4, 4, 4, 4, 4, 4, 4, 4, 4, 4, 4, 0, 0, 0, 0, 0, 0, 0, 0, 0, 0, 0, 0, 0, 0, 0, 0, 4, 0, 0, 0, 0, 0, 4, 4, 0, 0, 4, 4, 4, 4, 4, 4, 4, 4, 4, 4, 4, 4, 4, 4, 4, 4, 4, 4, 4, 4, 4, 4, 4, 4, 4, 4, 4, 4, 4, 4, 4, 4, 4, 4, 4, 4, 4, 4, 4, 4, 4, 4, 4, 4, 4, 4, 4, 0, 0, 0, 0, 4, 4, 4, 4, 4, 4, 4, 4, 4, 4, 4, 4, 4, 4, 4, 4, 4, 4, 4, 0, 4, 4, 4, 4, 0, 0, 0, 0, 0, 0, 0, 0, 0, 0, 0, 0, 0, 0, 0, 0, 0, 0, 0, 0, 0, 0, 0, 0, 4, 0, 0, 0, 0, 4, 4, 4, 4, 4, 4, 4, 4, 4, 4, 4, 4, 4], dtype=int32) - net_radiation(time)float32dask.array<chunksize=(48,), meta=np.ndarray>
- long_name :
- Net radiation
- units :
- W/m^2
- resolution :
- 0.1
- ancillary_variables :
- qc_net_radiation
- history :
- act.qc.datafilter: Value is equal to missing_value. act.qc.datafilter: Value is less than the fail_min. act.qc.datafilter: Value is greater than the fail_max.
Array Chunk Bytes 1.12 kiB 192 B Shape (288,) (48,) Dask graph 6 chunks in 1 graph layer Data type float32 numpy.ndarray - qc_net_radiation(time)int320 0 0 0 0 0 0 0 ... 0 0 0 0 0 0 0 0
- long_name :
- Quality check results on field: Net radiation
- units :
- 1
- flag_masks :
- [1, 2, 4]
- flag_meanings :
- ['Value is equal to missing_value.', 'Value is less than the fail_min.', 'Value is greater than the fail_max.']
- flag_assessments :
- ['Bad', 'Bad', 'Bad']
- fail_min :
- -200.0
- fail_max :
- 1000.0
- standard_name :
- quality_flag
array([0, 0, 0, 0, 0, 0, 0, 0, 0, 0, 0, 0, 0, 0, 0, 0, 0, 0, 0, 0, 0, 0, 0, 0, 0, 0, 0, 0, 0, 0, 0, 0, 0, 0, 0, 0, 0, 0, 0, 0, 0, 0, 0, 0, 0, 0, 0, 0, 0, 0, 0, 0, 0, 0, 0, 0, 0, 0, 0, 0, 0, 0, 0, 0, 0, 0, 0, 0, 0, 0, 0, 0, 0, 0, 0, 0, 0, 0, 0, 0, 0, 0, 0, 0, 0, 0, 0, 0, 0, 0, 0, 0, 0, 0, 0, 0, 0, 0, 0, 0, 0, 0, 0, 0, 0, 0, 0, 0, 0, 0, 0, 0, 0, 0, 0, 0, 0, 0, 0, 0, 0, 0, 0, 0, 0, 0, 0, 0, 0, 0, 0, 0, 0, 0, 0, 0, 0, 0, 0, 0, 0, 0, 0, 0, 0, 0, 0, 0, 0, 0, 0, 0, 0, 0, 0, 0, 0, 0, 0, 0, 0, 0, 0, 0, 0, 0, 0, 0, 0, 0, 0, 0, 0, 0, 0, 0, 0, 0, 0, 0, 0, 0, 0, 0, 0, 0, 0, 0, 0, 0, 0, 0, 0, 0, 0, 0, 0, 0, 0, 0, 0, 0, 0, 0, 0, 0, 0, 0, 0, 0, 0, 0, 0, 0, 0, 0, 0, 0, 0, 0, 0, 0, 0, 0, 0, 0, 0, 0, 0, 0, 0, 0, 0, 0, 0, 0, 0, 0, 0, 0, 0, 0, 0, 0, 0, 0, 0, 0, 0, 0, 0, 0, 0, 0, 0, 0, 0, 0, 0, 0, 0, 0, 0, 0, 0, 0, 0, 0, 0, 0, 0, 0, 0, 0, 0, 0, 0, 0, 0, 0, 0, 0, 0, 0, 0, 0, 0, 0], dtype=int32) - surface_soil_heat_flux_avg(time)float32dask.array<chunksize=(48,), meta=np.ndarray>
- long_name :
- Surface soil heat flux, average of fluxes 1-3
- units :
- W/m^2
- resolution :
- 0.1
- ancillary_variables :
- qc_surface_soil_heat_flux_avg
- history :
- act.qc.datafilter: Value is equal to missing_value. act.qc.datafilter: Value is less than the fail_min. act.qc.datafilter: Value is greater than the fail_max.
Array Chunk Bytes 1.12 kiB 192 B Shape (288,) (48,) Dask graph 6 chunks in 1 graph layer Data type float32 numpy.ndarray - qc_surface_soil_heat_flux_avg(time)int320 0 0 0 0 0 0 0 ... 0 0 0 0 0 0 0 0
- long_name :
- Quality check results on field: Surface soil heat flux, average of fluxes 1-3
- units :
- 1
- flag_masks :
- [1, 2, 4]
- flag_meanings :
- ['Value is equal to missing_value.', 'Value is less than the fail_min.', 'Value is greater than the fail_max.']
- flag_assessments :
- ['Bad', 'Bad', 'Bad']
- fail_min :
- -200.0
- fail_max :
- 100.0
- standard_name :
- quality_flag
array([0, 0, 0, 0, 0, 0, 0, 0, 0, 0, 0, 0, 0, 0, 0, 0, 0, 0, 0, 0, 0, 0, 0, 0, 0, 0, 0, 0, 0, 0, 0, 0, 0, 0, 0, 0, 0, 0, 0, 0, 0, 0, 0, 0, 0, 0, 0, 0, 0, 0, 0, 0, 0, 0, 0, 0, 0, 0, 0, 0, 0, 0, 0, 0, 0, 0, 0, 0, 0, 0, 0, 0, 0, 0, 0, 0, 0, 0, 0, 0, 0, 0, 0, 0, 0, 0, 0, 0, 0, 0, 0, 0, 0, 0, 0, 0, 0, 0, 0, 0, 0, 0, 0, 0, 0, 0, 0, 0, 0, 0, 0, 0, 0, 0, 0, 0, 0, 0, 0, 0, 0, 0, 0, 0, 0, 0, 0, 0, 0, 0, 0, 0, 0, 0, 0, 0, 0, 0, 0, 0, 0, 0, 0, 0, 0, 0, 0, 0, 0, 0, 0, 0, 0, 0, 0, 0, 0, 0, 0, 0, 0, 0, 0, 0, 0, 0, 0, 0, 0, 0, 0, 0, 0, 0, 0, 0, 0, 0, 0, 0, 0, 0, 0, 0, 0, 0, 0, 0, 0, 0, 0, 0, 0, 0, 0, 0, 0, 0, 0, 0, 0, 0, 0, 0, 0, 0, 0, 0, 0, 0, 0, 0, 0, 0, 0, 0, 0, 0, 0, 0, 0, 0, 0, 0, 0, 0, 0, 0, 0, 0, 0, 0, 0, 0, 0, 0, 0, 0, 0, 0, 0, 0, 0, 0, 0, 0, 0, 0, 0, 0, 0, 0, 0, 0, 0, 0, 0, 0, 0, 0, 0, 0, 0, 0, 0, 0, 0, 0, 0, 0, 0, 0, 0, 0, 0, 0, 0, 0, 0, 0, 0, 0, 0, 0, 0, 0, 0, 0], dtype=int32) - surface_energy_balance(time)float32dask.array<chunksize=(48,), meta=np.ndarray>
- long_name :
- Surface energy balance
- units :
- W/m^2
- resolution :
- 0.1
- ancillary_variables :
- qc_surface_energy_balance
- history :
- act.qc.datafilter: Value is equal to missing_value. act.qc.datafilter: Value is less than the fail_min. act.qc.datafilter: Value is greater than the fail_max.
Array Chunk Bytes 1.12 kiB 192 B Shape (288,) (48,) Dask graph 6 chunks in 1 graph layer Data type float32 numpy.ndarray - qc_surface_energy_balance(time)int320 0 0 0 0 0 0 0 ... 0 0 0 0 0 0 0 0
- long_name :
- Quality check results on field: Surface energy balance
- units :
- 1
- flag_masks :
- [1, 2, 4]
- flag_meanings :
- ['Value is equal to missing_value.', 'Value is less than the fail_min.', 'Value is greater than the fail_max.']
- flag_assessments :
- ['Bad', 'Bad', 'Bad']
- fail_min :
- -500.0
- fail_max :
- 1200.0
- standard_name :
- quality_flag
array([0, 0, 0, 0, 0, 0, 0, 0, 0, 0, 0, 0, 0, 0, 0, 0, 0, 0, 0, 0, 0, 0, 0, 0, 0, 0, 0, 0, 0, 0, 0, 0, 0, 0, 0, 0, 0, 0, 0, 0, 0, 0, 0, 0, 0, 0, 0, 0, 0, 0, 0, 0, 0, 0, 0, 0, 0, 0, 0, 0, 0, 0, 0, 0, 0, 0, 0, 0, 0, 0, 0, 0, 0, 0, 0, 0, 0, 0, 0, 0, 0, 0, 0, 0, 0, 0, 0, 0, 0, 0, 0, 0, 0, 0, 0, 0, 0, 0, 0, 0, 0, 0, 0, 0, 0, 0, 0, 0, 0, 0, 0, 0, 0, 0, 0, 0, 0, 0, 0, 0, 0, 0, 0, 0, 0, 0, 0, 0, 0, 0, 0, 0, 0, 0, 0, 0, 0, 0, 0, 0, 0, 0, 0, 0, 0, 0, 0, 0, 0, 0, 0, 0, 0, 0, 0, 0, 0, 0, 0, 0, 0, 0, 0, 0, 0, 0, 0, 0, 0, 0, 0, 0, 0, 0, 0, 0, 0, 0, 0, 0, 0, 0, 0, 0, 0, 0, 0, 0, 0, 0, 0, 0, 0, 0, 0, 0, 0, 0, 0, 0, 0, 0, 0, 0, 0, 0, 0, 0, 0, 0, 0, 0, 0, 0, 0, 0, 0, 0, 0, 0, 0, 0, 0, 0, 0, 0, 0, 0, 0, 0, 0, 0, 0, 0, 0, 0, 0, 0, 0, 0, 0, 0, 0, 0, 0, 0, 0, 0, 0, 0, 0, 0, 0, 0, 0, 0, 0, 0, 0, 0, 0, 0, 0, 0, 0, 0, 0, 0, 0, 0, 0, 0, 0, 0, 0, 0, 0, 0, 0, 0, 0, 0, 0, 0, 0, 0, 0, 0], dtype=int32) - wetness(time)float32dask.array<chunksize=(48,), meta=np.ndarray>
- long_name :
- Wetness, rain detector
- units :
- V
- resolution :
- 0.01
- comment :
- 3 V indicates sensor is dry, 1 V indicates sensor is fully wetted
- ancillary_variables :
- qc_wetness
- history :
- act.qc.datafilter: Value is equal to missing_value. act.qc.datafilter: Value is less than the fail_min. act.qc.datafilter: Value is greater than the fail_max.
Array Chunk Bytes 1.12 kiB 192 B Shape (288,) (48,) Dask graph 6 chunks in 1 graph layer Data type float32 numpy.ndarray - qc_wetness(time)int320 0 0 0 0 0 0 0 ... 0 0 0 0 0 0 0 0
- long_name :
- Quality check results on field: Wetness, rain detector
- units :
- 1
- flag_masks :
- [1, 2, 4]
- flag_meanings :
- ['Value is equal to missing_value.', 'Value is less than the fail_min.', 'Value is greater than the fail_max.']
- flag_assessments :
- ['Bad', 'Bad', 'Bad']
- fail_min :
- 0.85
- fail_max :
- 3.1
- standard_name :
- quality_flag
array([0, 0, 0, 0, 0, 0, 0, 0, 0, 0, 0, 0, 0, 0, 0, 0, 0, 0, 0, 0, 0, 0, 0, 0, 0, 0, 0, 0, 0, 0, 0, 0, 0, 0, 0, 0, 0, 0, 0, 0, 0, 0, 0, 0, 0, 0, 0, 0, 0, 0, 0, 0, 0, 0, 0, 0, 0, 0, 0, 0, 0, 0, 0, 0, 0, 0, 0, 0, 0, 0, 0, 0, 0, 0, 0, 0, 0, 0, 0, 0, 0, 0, 0, 0, 0, 0, 0, 0, 0, 0, 0, 0, 0, 0, 0, 0, 0, 0, 0, 0, 0, 0, 0, 0, 0, 0, 0, 0, 0, 0, 0, 0, 0, 0, 0, 0, 0, 0, 0, 0, 0, 0, 0, 0, 0, 0, 0, 0, 0, 0, 0, 0, 0, 0, 0, 0, 0, 0, 0, 0, 0, 0, 0, 0, 0, 0, 0, 0, 0, 0, 0, 0, 0, 0, 0, 0, 0, 0, 0, 0, 0, 0, 0, 0, 0, 0, 0, 0, 0, 0, 0, 0, 0, 0, 0, 0, 0, 0, 0, 0, 0, 0, 0, 0, 0, 0, 0, 0, 0, 0, 0, 0, 0, 0, 0, 0, 0, 0, 0, 0, 0, 0, 0, 0, 0, 0, 0, 0, 0, 0, 0, 0, 0, 0, 0, 0, 0, 0, 0, 0, 0, 0, 0, 0, 0, 0, 0, 0, 0, 0, 0, 0, 0, 0, 0, 0, 0, 0, 0, 0, 0, 0, 0, 0, 0, 0, 0, 0, 0, 0, 0, 0, 0, 0, 0, 0, 0, 0, 0, 0, 0, 0, 0, 0, 0, 0, 0, 0, 0, 0, 0, 0, 0, 0, 0, 0, 0, 0, 0, 0, 0, 0, 0, 0, 0, 0, 0, 0], dtype=int32) - temp_net_radiometer(time)float32dask.array<chunksize=(48,), meta=np.ndarray>
- long_name :
- Net radiometer temperature
- units :
- degC
- resolution :
- 0.01
- ancillary_variables :
- qc_temp_net_radiometer
- history :
- act.qc.datafilter: Value is equal to missing_value. act.qc.datafilter: Value is less than the fail_min. act.qc.datafilter: Value is greater than the fail_max.
Array Chunk Bytes 1.12 kiB 192 B Shape (288,) (48,) Dask graph 6 chunks in 1 graph layer Data type float32 numpy.ndarray - qc_temp_net_radiometer(time)int320 0 0 0 0 0 0 0 ... 0 0 0 0 0 0 0 0
- long_name :
- Quality check results on field: Net radiometer temperature
- units :
- 1
- flag_masks :
- [1, 2, 4]
- flag_meanings :
- ['Value is equal to missing_value.', 'Value is less than the fail_min.', 'Value is greater than the fail_max.']
- flag_assessments :
- ['Bad', 'Bad', 'Bad']
- fail_min :
- -40.0
- fail_max :
- 50.0
- standard_name :
- quality_flag
array([0, 0, 0, 0, 0, 0, 0, 0, 0, 0, 0, 0, 0, 0, 0, 0, 0, 0, 0, 0, 0, 0, 0, 0, 0, 0, 0, 0, 0, 0, 0, 0, 0, 0, 0, 0, 0, 0, 0, 0, 0, 0, 0, 0, 0, 0, 0, 0, 0, 0, 0, 0, 0, 0, 0, 0, 0, 0, 0, 0, 0, 0, 0, 0, 0, 0, 0, 0, 0, 0, 0, 0, 0, 0, 0, 0, 0, 0, 0, 0, 0, 0, 0, 0, 0, 0, 0, 0, 0, 0, 0, 0, 0, 0, 0, 0, 0, 0, 0, 0, 0, 0, 0, 0, 0, 0, 0, 0, 0, 0, 0, 0, 0, 0, 0, 0, 0, 0, 0, 0, 0, 0, 0, 0, 0, 0, 0, 0, 0, 0, 0, 0, 0, 0, 0, 0, 0, 0, 0, 0, 0, 0, 0, 0, 0, 0, 0, 0, 0, 0, 0, 0, 0, 0, 0, 0, 0, 0, 0, 0, 0, 0, 0, 0, 0, 0, 0, 0, 0, 0, 0, 0, 0, 0, 0, 0, 0, 0, 0, 0, 0, 0, 0, 0, 0, 0, 0, 0, 0, 0, 0, 0, 0, 0, 0, 0, 0, 0, 0, 0, 0, 0, 0, 0, 0, 0, 0, 0, 0, 0, 0, 0, 0, 0, 0, 0, 0, 0, 0, 0, 0, 0, 0, 0, 0, 0, 0, 0, 0, 0, 0, 0, 0, 0, 0, 0, 0, 0, 0, 0, 0, 0, 0, 0, 0, 0, 0, 0, 0, 0, 0, 0, 0, 0, 0, 0, 0, 0, 0, 0, 0, 0, 0, 0, 0, 0, 0, 0, 0, 0, 0, 0, 0, 0, 0, 0, 0, 0, 0, 0, 0, 0, 0, 0, 0, 0, 0, 0], dtype=int32) - battery_voltage(time)float32dask.array<chunksize=(48,), meta=np.ndarray>
- long_name :
- Battery voltage
- units :
- V
- resolution :
- 0.01
- ancillary_variables :
- qc_battery_voltage
- history :
- act.qc.datafilter: Value is equal to missing_value. act.qc.datafilter: Value is less than the fail_min. act.qc.datafilter: Value is greater than the fail_max.
Array Chunk Bytes 1.12 kiB 192 B Shape (288,) (48,) Dask graph 6 chunks in 1 graph layer Data type float32 numpy.ndarray - qc_battery_voltage(time)int320 0 0 0 0 0 0 0 ... 0 0 0 0 0 0 0 0
- long_name :
- Quality check results on field: Battery voltage
- units :
- 1
- flag_masks :
- [1, 2, 4]
- flag_meanings :
- ['Value is equal to missing_value.', 'Value is less than the fail_min.', 'Value is greater than the fail_max.']
- flag_assessments :
- ['Bad', 'Bad', 'Bad']
- fail_min :
- 0.0
- fail_max :
- 15.0
- standard_name :
- quality_flag
array([0, 0, 0, 0, 0, 0, 0, 0, 0, 0, 0, 0, 0, 0, 0, 0, 0, 0, 0, 0, 0, 0, 0, 0, 0, 0, 0, 0, 0, 0, 0, 0, 0, 0, 0, 0, 0, 0, 0, 0, 0, 0, 0, 0, 0, 0, 0, 0, 0, 0, 0, 0, 0, 0, 0, 0, 0, 0, 0, 0, 0, 0, 0, 0, 0, 0, 0, 0, 0, 0, 0, 0, 0, 0, 0, 0, 0, 0, 0, 0, 0, 0, 0, 0, 0, 0, 0, 0, 0, 0, 0, 0, 0, 0, 0, 0, 0, 0, 0, 0, 0, 0, 0, 0, 0, 0, 0, 0, 0, 0, 0, 0, 0, 0, 0, 0, 0, 0, 0, 0, 0, 0, 0, 0, 0, 0, 0, 0, 0, 0, 0, 0, 0, 0, 0, 0, 0, 0, 0, 0, 0, 0, 0, 0, 0, 0, 0, 0, 0, 0, 0, 0, 0, 0, 0, 0, 0, 0, 0, 0, 0, 0, 0, 0, 0, 0, 0, 0, 0, 0, 0, 0, 0, 0, 0, 0, 0, 0, 0, 0, 0, 0, 0, 0, 0, 0, 0, 0, 0, 0, 0, 0, 0, 0, 0, 0, 0, 0, 0, 0, 0, 0, 0, 0, 0, 0, 0, 0, 0, 0, 0, 0, 0, 0, 0, 0, 0, 0, 0, 0, 0, 0, 0, 0, 0, 0, 0, 0, 0, 0, 0, 0, 0, 0, 0, 0, 0, 0, 0, 0, 0, 0, 0, 0, 0, 0, 0, 0, 0, 0, 0, 0, 0, 0, 0, 0, 0, 0, 0, 0, 0, 0, 0, 0, 0, 0, 0, 0, 0, 0, 0, 0, 0, 0, 0, 0, 0, 0, 0, 0, 0, 0, 0, 0, 0, 0, 0, 0], dtype=int32) - lat(time)float3238.96 38.96 38.96 ... 38.96 38.96
- long_name :
- North latitude
- units :
- degree_N
- valid_min :
- -90.0
- valid_max :
- 90.0
array([38.956158, 38.956158, 38.956158, 38.956158, 38.956158, 38.956158, 38.956158, 38.956158, 38.956158, 38.956158, 38.956158, 38.956158, 38.956158, 38.956158, 38.956158, 38.956158, 38.956158, 38.956158, 38.956158, 38.956158, 38.956158, 38.956158, 38.956158, 38.956158, 38.956158, 38.956158, 38.956158, 38.956158, 38.956158, 38.956158, 38.956158, 38.956158, 38.956158, 38.956158, 38.956158, 38.956158, 38.956158, 38.956158, 38.956158, 38.956158, 38.956158, 38.956158, 38.956158, 38.956158, 38.956158, 38.956158, 38.956158, 38.956158, 38.956158, 38.956158, 38.956158, 38.956158, 38.956158, 38.956158, 38.956158, 38.956158, 38.956158, 38.956158, 38.956158, 38.956158, 38.956158, 38.956158, 38.956158, 38.956158, 38.956158, 38.956158, 38.956158, 38.956158, 38.956158, 38.956158, 38.956158, 38.956158, 38.956158, 38.956158, 38.956158, 38.956158, 38.956158, 38.956158, 38.956158, 38.956158, 38.956158, 38.956158, 38.956158, 38.956158, 38.956158, 38.956158, 38.956158, 38.956158, 38.956158, 38.956158, 38.956158, 38.956158, 38.956158, 38.956158, 38.956158, 38.956158, 38.956158, 38.956158, 38.956158, 38.956158, 38.956158, 38.956158, 38.956158, 38.956158, 38.956158, 38.956158, 38.956158, 38.956158, 38.956158, 38.956158, 38.956158, 38.956158, 38.956158, 38.956158, 38.956158, 38.956158, 38.956158, 38.956158, 38.956158, 38.956158, ... 38.956158, 38.956158, 38.956158, 38.956158, 38.956158, 38.956158, 38.956158, 38.956158, 38.956158, 38.956158, 38.956158, 38.956158, 38.956158, 38.956158, 38.956158, 38.956158, 38.956158, 38.956158, 38.956158, 38.956158, 38.956158, 38.956158, 38.956158, 38.956158, 38.956158, 38.956158, 38.956158, 38.956158, 38.956158, 38.956158, 38.956158, 38.956158, 38.956158, 38.956158, 38.956158, 38.956158, 38.956158, 38.956158, 38.956158, 38.956158, 38.956158, 38.956158, 38.956158, 38.956158, 38.956158, 38.956158, 38.956158, 38.956158, 38.956158, 38.956158, 38.956158, 38.956158, 38.956158, 38.956158, 38.956158, 38.956158, 38.956158, 38.956158, 38.956158, 38.956158, 38.956158, 38.956158, 38.956158, 38.956158, 38.956158, 38.956158, 38.956158, 38.956158, 38.956158, 38.956158, 38.956158, 38.956158, 38.956158, 38.956158, 38.956158, 38.956158, 38.956158, 38.956158, 38.956158, 38.956158, 38.956158, 38.956158, 38.956158, 38.956158, 38.956158, 38.956158, 38.956158, 38.956158, 38.956158, 38.956158, 38.956158, 38.956158, 38.956158, 38.956158, 38.956158, 38.956158, 38.956158, 38.956158, 38.956158, 38.956158, 38.956158, 38.956158, 38.956158, 38.956158, 38.956158, 38.956158, 38.956158, 38.956158, 38.956158, 38.956158, 38.956158, 38.956158, 38.956158, 38.956158], dtype=float32) - lon(time)float32-107.0 -107.0 ... -107.0 -107.0
- long_name :
- East longitude
- units :
- degree_E
- valid_min :
- -180.0
- valid_max :
- 180.0
array([-106.987854, -106.987854, -106.987854, -106.987854, -106.987854, -106.987854, -106.987854, -106.987854, -106.987854, -106.987854, -106.987854, -106.987854, -106.987854, -106.987854, -106.987854, -106.987854, -106.987854, -106.987854, -106.987854, -106.987854, -106.987854, -106.987854, -106.987854, -106.987854, -106.987854, -106.987854, -106.987854, -106.987854, -106.987854, -106.987854, -106.987854, -106.987854, -106.987854, -106.987854, -106.987854, -106.987854, -106.987854, -106.987854, -106.987854, -106.987854, -106.987854, -106.987854, -106.987854, -106.987854, -106.987854, -106.987854, -106.987854, -106.987854, -106.987854, -106.987854, -106.987854, -106.987854, -106.987854, -106.987854, -106.987854, -106.987854, -106.987854, -106.987854, -106.987854, -106.987854, -106.987854, -106.987854, -106.987854, -106.987854, -106.987854, -106.987854, -106.987854, -106.987854, -106.987854, -106.987854, -106.987854, -106.987854, -106.987854, -106.987854, -106.987854, -106.987854, -106.987854, -106.987854, -106.987854, -106.987854, -106.987854, -106.987854, -106.987854, -106.987854, -106.987854, -106.987854, -106.987854, -106.987854, -106.987854, -106.987854, -106.987854, -106.987854, -106.987854, -106.987854, -106.987854, -106.987854, -106.987854, -106.987854, -106.987854, -106.987854, ... -106.987854, -106.987854, -106.987854, -106.987854, -106.987854, -106.987854, -106.987854, -106.987854, -106.987854, -106.987854, -106.987854, -106.987854, -106.987854, -106.987854, -106.987854, -106.987854, -106.987854, -106.987854, -106.987854, -106.987854, -106.987854, -106.987854, -106.987854, -106.987854, -106.987854, -106.987854, -106.987854, -106.987854, -106.987854, -106.987854, -106.987854, -106.987854, -106.987854, -106.987854, -106.987854, -106.987854, -106.987854, -106.987854, -106.987854, -106.987854, -106.987854, -106.987854, -106.987854, -106.987854, -106.987854, -106.987854, -106.987854, -106.987854, -106.987854, -106.987854, -106.987854, -106.987854, -106.987854, -106.987854, -106.987854, -106.987854, -106.987854, -106.987854, -106.987854, -106.987854, -106.987854, -106.987854, -106.987854, -106.987854, -106.987854, -106.987854, -106.987854, -106.987854, -106.987854, -106.987854, -106.987854, -106.987854, -106.987854, -106.987854, -106.987854, -106.987854, -106.987854, -106.987854, -106.987854, -106.987854, -106.987854, -106.987854, -106.987854, -106.987854, -106.987854, -106.987854, -106.987854, -106.987854, -106.987854, -106.987854, -106.987854, -106.987854, -106.987854, -106.987854, -106.987854, -106.987854, -106.987854, -106.987854], dtype=float32) - alt(time)float322.886e+03 2.886e+03 ... 2.886e+03
- long_name :
- Altitude above mean sea level
- units :
- m
array([2886., 2886., 2886., 2886., 2886., 2886., 2886., 2886., 2886.,
       2886., 2886., 2886., 2886., 2886., 2886., 2886., 2886., 2886.,
       2886., 2886., 2886., 2886., 2886., 2886., 2886., 2886., 2886.,
       2886., 2886., 2886., 2886., 2886., 2886., 2886., 2886., 2886.,
       2886., 2886., 2886., 2886., 2886., 2886., 2886., 2886., 2886.,
       2886., 2886., 2886., 2886., 2886., 2886., 2886., 2886., 2886.,
       2886., 2886., 2886., 2886., 2886., 2886., 2886., 2886., 2886.,
       2886., 2886., 2886., 2886., 2886., 2886., 2886., 2886., 2886.,
       2886., 2886., 2886., 2886., 2886., 2886., 2886., 2886., 2886.,
       2886., 2886., 2886., 2886., 2886., 2886., 2886., 2886., 2886.,
       2886., 2886., 2886., 2886., 2886., 2886., 2886., 2886., 2886.,
       2886., 2886., 2886., 2886., 2886., 2886., 2886., 2886., 2886.,
       2886., 2886., 2886., 2886., 2886., 2886., 2886., 2886., 2886.,
       2886., 2886., 2886., 2886., 2886., 2886., 2886., 2886., 2886.,
       2886., 2886., 2886., 2886., 2886., 2886., 2886., 2886., 2886.,
       2886., 2886., 2886., 2886., 2886., 2886., 2886., 2886., 2886.,
       2886., 2886., 2886., 2886., 2886., 2886., 2886., 2886., 2886.,
       2886., 2886., 2886., 2886., 2886., 2886., 2886., 2886., 2886.,
       2886., 2886., 2886., 2886., 2886., 2886., 2886., 2886., 2886.,
       2886., 2886., 2886., 2886., 2886., 2886., 2886., 2886., 2886.,
       2886., 2886., 2886., 2886., 2886., 2886., 2886., 2886., 2886.,
       2886., 2886., 2886., 2886., 2886., 2886., 2886., 2886., 2886.,
       2886., 2886., 2886., 2886., 2886., 2886., 2886., 2886., 2886.,
       2886., 2886., 2886., 2886., 2886., 2886., 2886., 2886., 2886.,
       2886., 2886., 2886., 2886., 2886., 2886., 2886., 2886., 2886.,
       2886., 2886., 2886., 2886., 2886., 2886., 2886., 2886., 2886.,
       2886., 2886., 2886., 2886., 2886., 2886., 2886., 2886., 2886.,
       2886., 2886., 2886., 2886., 2886., 2886., 2886., 2886., 2886.,
       2886., 2886., 2886., 2886., 2886., 2886., 2886., 2886., 2886.,
       2886., 2886., 2886., 2886., 2886., 2886., 2886., 2886., 2886.,
       2886., 2886., 2886., 2886., 2886., 2886., 2886., 2886., 2886.,
       2886., 2886., 2886., 2886., 2886., 2886., 2886., 2886., 2886.],
      dtype=float32)
- timePandasIndex
PandasIndex(DatetimeIndex(['2022-01-02 00:00:00', '2022-01-02 00:30:00',
               '2022-01-02 01:00:00', '2022-01-02 01:30:00',
               '2022-01-02 02:00:00', '2022-01-02 02:30:00',
               '2022-01-02 03:00:00', '2022-01-02 03:30:00',
               '2022-01-02 04:00:00', '2022-01-02 04:30:00',
               ...
               '2022-01-07 19:00:00', '2022-01-07 19:30:00',
               '2022-01-07 20:00:00', '2022-01-07 20:30:00',
               '2022-01-07 21:00:00', '2022-01-07 21:30:00',
               '2022-01-07 22:00:00', '2022-01-07 22:30:00',
               '2022-01-07 23:00:00', '2022-01-07 23:30:00'],
              dtype='datetime64[ns]', name='time', length=288, freq=None))
- command_line :
- sebs_ingest -s guc -f M1
- process_version :
- ingest-sebs-1.6-0.el7
- ingest_software :
- ingest-sebs-1.6-0.el7
- dod_version :
- sebs-b1-1.4
- site_id :
- guc
- facility_id :
- M1: Mt Crested Butte, Colorado
- data_level :
- b1
- input_source :
- /data/collection/guc/gucsebsM1.00/SEBS_Table30.20220102000000.dat
- resolution_description :
- The resolution field attributes refer to the number of significant digits relative to the decimal point that should be used in calculations. Using fewer digits might result in greater uncertainty. Using a larger number of digits should have no effect and thus is unnecessary. However, analyses based on differences in values with a larger number of significant digits than indicated could lead to erroneous results or misleading scientific conclusions. resolution for lat = 0.001 resolution for lon = 0.001 resolution for alt = 1
- averaging_interval :
- 30 minutes
- sampling_interval :
- 5 seconds
- serial_number :
- N/A
- cdl_program_signature :
- 43690
- qc_standards_version :
- 1.0
- qc_method :
- Standard Mentor QC
- qc_comment :
- The QC field values are a bit packed representation of true/false values for the tests that may have been performed. A QC value of zero means that none of the tests performed on the value failed. The QC field values make use of the internal binary format to store the results of the individual QC tests. This allows the representation of multiple QC states in a single value. If the test associated with a particular bit fails the bit is turned on. Turning on the bit equates to adding the integer value of the failed test to the current value of the field. The QC field's value can be interpretted by applying bit logic using bitwise operators, or by examing the QC value's integer representation. A QC field's integer representation is the sum of the individual integer values of the failed tests. The bit and integer equalivalents for the first 5 bits are listed below: bit_1 = 00000001 = 0x01 = 2^0 = 1 bit_2 = 00000010 = 0x02 = 2^1 = 2 bit_3 = 00000100 = 0x04 = 2^2 = 4 bit_4 = 00001000 = 0x08 = 2^3 = 8 bit_5 = 00010000 = 0x10 = 2^4 = 16
- datastream :
- gucsebsM1.b1
- history :
- created by user dsmgr on machine procnode2 at 2022-01-02 19:20:59, using ingest-sebs-1.6-0.el7
- _file_dates :
- ['20220102', '20220103', '20220104', '20220105', '20220106', '20220107']
- _file_times :
- ['000000', '000000', '000000', '000000', '000000', '000000']
- _datastream :
- gucsebsM1.b1
- _arm_standards_flag :
- 1
# Visualize the SEBS albedo measurement
plt.figure(figsize=(5.5,2), dpi=150)
plt.plot(ds_rad1['time'], ds_rad1['albedo'], '.-')
plt.xticks(fontsize=7)
plt.yticks(np.arange(0,1.1,0.2),fontsize=8)
plt.ylabel('albedo')
plt.grid()
plt.title('Control event')
plt.show()

plt.figure(figsize=(5.5,2), dpi=150)
plt.plot(ds_rad2['time'], ds_rad2['albedo'], '.-')
plt.xticks(fontsize=7)
plt.yticks(np.arange(0,1.1,0.2),fontsize=8)
plt.ylabel('albedo')
plt.grid()
plt.title('Black carbon event')
plt.show()

plt.figure(figsize=(5.5,2), dpi=150)
plt.plot(ds_rad3['time'], ds_rad3['albedo'], '.-')
plt.xticks(fontsize=7)
plt.yticks(np.arange(0,1.1,0.2),fontsize=8)
plt.ylabel('albedo')
plt.grid()
plt.title('Dust event')
plt.show()
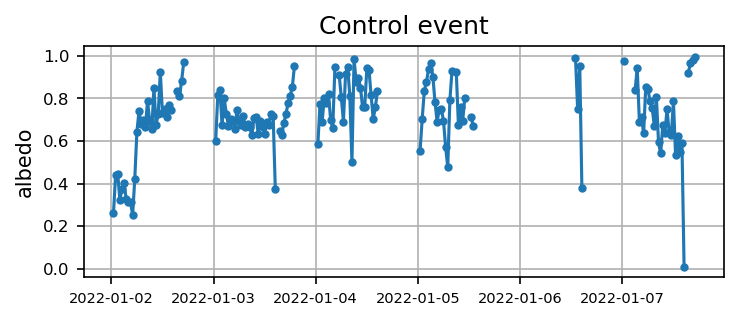
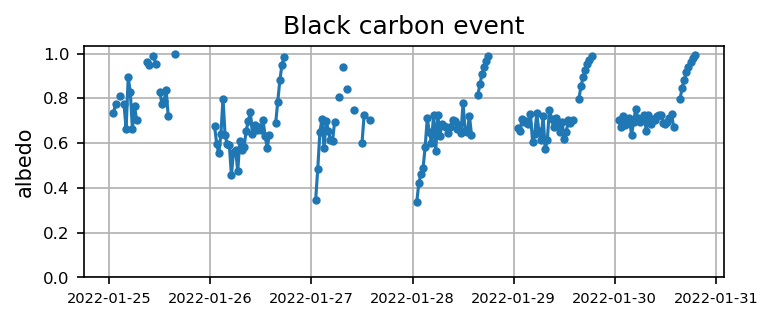
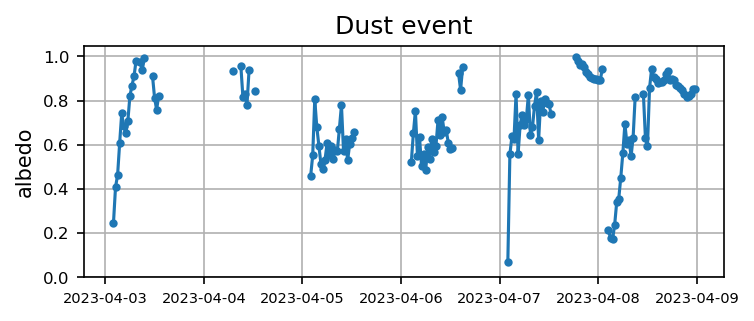
Compute the daily albedo
daily_swdn1 = ds_rad1["down_short_hemisp"].groupby("time.day").mean()
daily_swup1 = ds_rad1["up_short_hemisp"].groupby("time.day").mean()
daily_alb1 = daily_swup1 / daily_swdn1

daily_swdn2 = ds_rad2["down_short_hemisp"].groupby("time.day").mean()
daily_swup2 = ds_rad2["up_short_hemisp"].groupby("time.day").mean()
daily_alb2 = daily_swup2 / daily_swdn2

daily_swdn3 = ds_rad3["down_short_hemisp"].groupby("time.day").mean()
daily_swup3 = ds_rad3["up_short_hemisp"].groupby("time.day").mean()
daily_alb3 = daily_swup3 / daily_swdn3
print("Control event: ")
print(daily_alb1.values)

print("Black carbon event: ")
print(daily_alb2.values)

print("Dust event: ")
print(daily_alb3.values)
Control event:
[1.0085437 0.9353342 1.0606952 1.1239946 1.1336114 1.0593574]
Black carbon event:
[1.092211  1.0429021 1.0889456 1.0354402 1.0187626 1.0055703]
Dust event:
[1.0760224 1.1429528 1.0815936 1.0035297 0.9791858 0.8345441]
plt.figure(figsize=(5,3), dpi=150)

plt.plot(np.arange(1,7), daily_alb1, '.--', label='control event')
plt.plot(np.arange(1,7), daily_alb2, 'o-', label='black carbon event')
plt.plot(np.arange(1,7), daily_alb3, '^-', label='dust event')

plt.xlabel('days')
plt.ylabel('daily albedo')
plt.legend(fontsize=8)
<matplotlib.legend.Legend at 0x7f859e65b010>
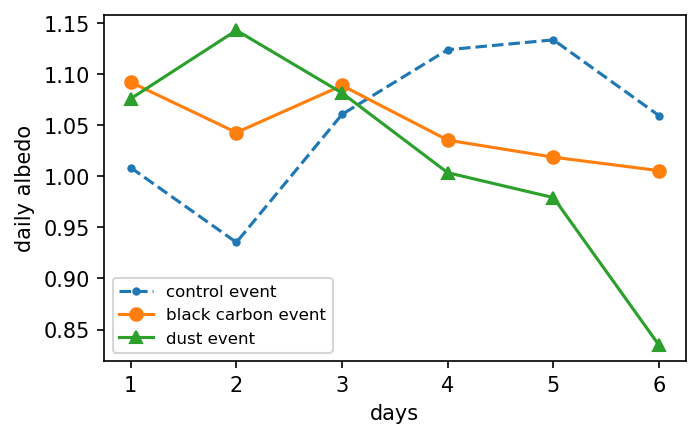
Remove the diurnal cycle
# calculate the mean by hour of each day
ds_rad["albedo"].groupby("time.hour").mean()
<xarray.DataArray 'albedo' (hour: 24)> Size: 96B
dask.array<stack, shape=(24,), dtype=float32, chunksize=(1,), chunktype=numpy.ndarray>
Coordinates:
  * hour     (hour) int64 192B 0 1 2 3 4 5 6 7 8 ... 15 16 17 18 19 20 21 22 23
Attributes:
    long_name:            Albedo
    units:                fraction
    resolution:           0.01
    ancillary_variables:  qc_albedo
    history:              act.qc.datafilter: Value is equal to missing_value....
xarray.DataArray
'albedo'
- hour: 24
- dask.array<chunksize=(1,), meta=np.ndarray>
Array Chunk Bytes 96 B 4 B Shape (24,) (1,) Dask graph 24 chunks in 98 graph layers Data type float32 numpy.ndarray - hour(hour)int640 1 2 3 4 5 6 ... 18 19 20 21 22 23
array([ 0,  1,  2,  3,  4,  5,  6,  7,  8,  9, 10, 11, 12, 13, 14, 15, 16, 17,
       18, 19, 20, 21, 22, 23])
- hourPandasIndex
PandasIndex(Index([ 0,  1,  2,  3,  4,  5,  6,  7,  8,  9, 10, 11, 12, 13, 14, 15, 16, 17,
       18, 19, 20, 21, 22, 23],
      dtype='int64', name='hour'))
- long_name :
- Albedo
- units :
- fraction
- resolution :
- 0.01
- ancillary_variables :
- qc_albedo
- history :
- act.qc.datafilter: Value is equal to missing_value. act.qc.datafilter: Value is less than the fail_min. act.qc.datafilter: Value is greater than the fail_max.
# convert xarray to numpy array
albnew = ds_rad["albedo"].to_numpy()
albnew_mean = np.nanmean(np.reshape(albnew, (48, numdate)), axis=1)
/tmp/ipykernel_889/3833715621.py:2: RuntimeWarning: Mean of empty slice
  albnew_mean = np.nanmean(np.reshape(albnew, (48, numdate)), axis=1)
albnew_mean
array([0.7546998 , 0.78627324, 0.7391871 , 0.9564656 , 0.9254629 ,
       0.78026956, 0.9990803 ,        nan,        nan,        nan,
       0.6529938 , 0.5685541 , 0.5619452 , 0.68203145, 0.6654394 ,
       0.63507694, 0.8997505 ,        nan,        nan, 0.4155189 ,
       0.65742755, 0.68151975, 0.8915504 , 0.7463517 , 0.6756153 ,
              nan,        nan,        nan,        nan, 0.426916  ,
       0.65423656, 0.65689987, 0.67782056, 0.684446  , 0.6697173 ,
       0.89897907, 0.9886965 ,        nan, 0.6659013 , 0.6879279 ,
       0.67221844, 0.6544498 , 0.6877172 , 0.67176163, 0.7859972 ,
       0.9474498 ,        nan,        nan], dtype=float32)
# Remove the diurnal cycle from the surface albedo
alb = albnew - np.repeat(albnew_mean, numdate)
alb.shape
(240,)
plt.plot(ds_rad['time'], alb, '.-')
[<matplotlib.lines.Line2D at 0x7f859f70f3d0>]