Demonstrate a variety of calculations in MetPy.
import metpy.calc as mpcalc
import xarray as xr
import numpy as np
from metpy.calc import geostrophic_wind
from metpy.calc import q_vector
from metpy.units import units
import matplotlib.pyplot as plt
import cartopy.crs as ccrs
import cartopy.feature as cfeature
from scipy.ndimage.filters import gaussian_filter
/tmp/ipykernel_4112/2639708157.py:10: DeprecationWarning: Please import `gaussian_filter` from the `scipy.ndimage` namespace; the `scipy.ndimage.filters` namespace is deprecated and will be removed in SciPy 2.0.0.
from scipy.ndimage.filters import gaussian_filter
## opening NetCDF file using xarray

ds = xr.open_dataset("../convective/NETCDF_FILE.nc", decode_times=True)dsLoading...
#### making a function to slice the xarray dataset according to our need.
def slicer (data,lat1, lat2, lon1, lon2, time1,time2) :
    sliced_data = data.sel(lat =slice(lat1, lat2), lon = slice(lon1, lon2),time = slice(time1, time2))
    return sliced_data
#slicing the data for CONUS only
new_data = slicer(ds,23.5,50.5,-125.5,-66.5, ds.time[0], ds.time[0])new_dataLoading...
###extracting temperature, pressure, and geopotential from the dataset
gph = new_data.H
p =new_data.lev
T = new_data.TgphLoading...
U,V = geostrophic_wind(gph)np.shape(U)(1, 23, 28, 60)dataproj = ccrs. PlateCarree ()
# # Plot projection
# # The look you want for the view.
plotproj = ccrs. PlateCarree ()
fig=plt.figure(1, figsize=(15.,12.))
ax=plt.subplot(111,projection=plotproj)
ax.add_feature(cfeature.COASTLINE, linewidth=0.5)
ax.add_feature(cfeature.STATES, linewidth=0.5)
plt.title("Geostrophic Wind Calculated Using Metpy",size = 30)
plt.quiver (new_data.lon, new_data.lat, U[0,12,:,:],V[0,12,:,:],minlength = 0.5,units='width')
# plt.colorbar (orientation = "horizontal", pad=0.01).ax.tick_params(labelsize=20)
plt. show ()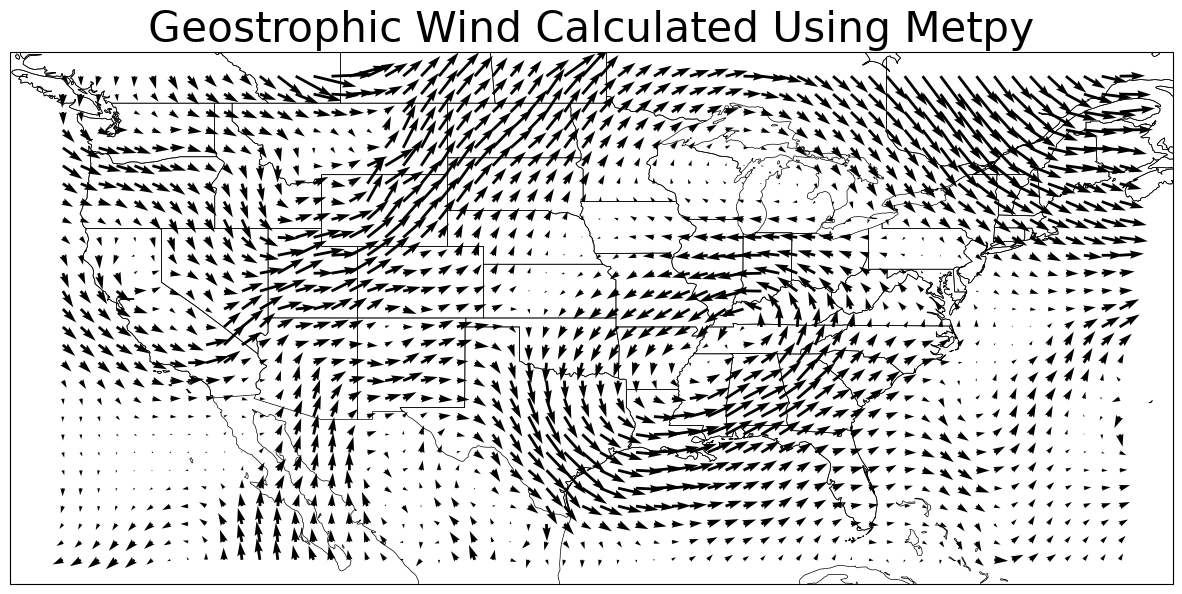
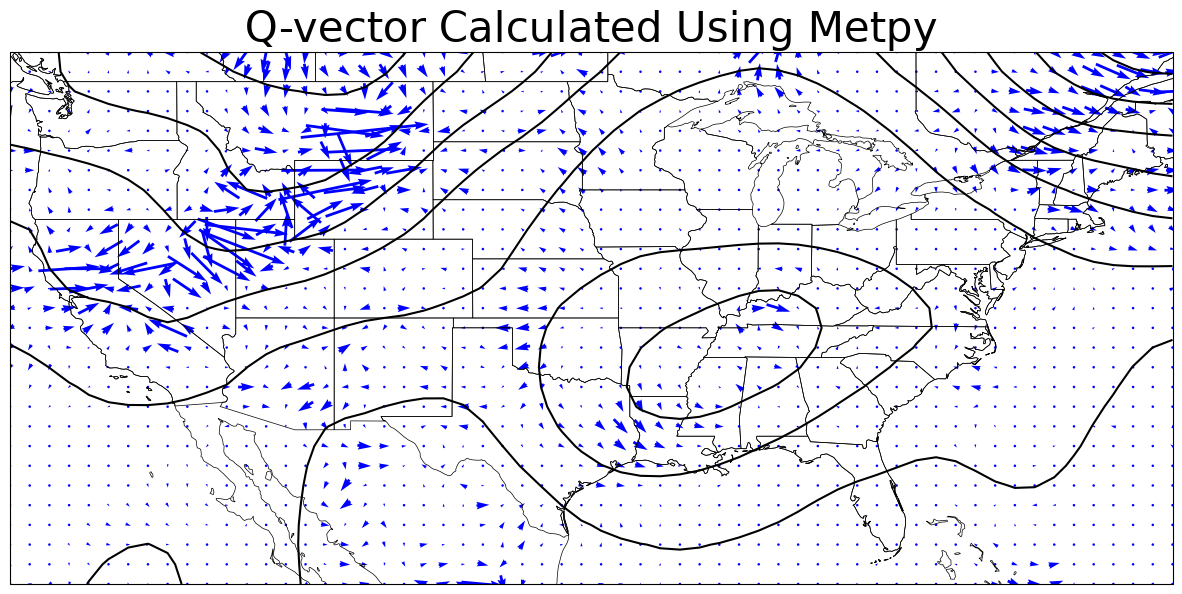
qx, qy = q_vector(U,V,T,p)dataproj = ccrs. PlateCarree ()
# # Plot projection
# # The look you want for the view.
plotproj = ccrs. PlateCarree ()
fig=plt.figure(1, figsize=(15.,12.))
ax=plt.subplot(111,projection=plotproj)
ax.add_feature(cfeature.COASTLINE, linewidth=0.5)
ax.add_feature(cfeature.STATES, linewidth=0.5)
plt.title("Q-vector Calculated Using Metpy",size = 30)
plt.contour(new_data.lon, new_data.lat,gaussian_filter(gph[0,12,:,:],1), colors = "black")
# plt.contourf(new_data.lon, new_data.lat, new_data.OMEGA[0,12,:,:],levels =np.arange(-2,2,0.2),cmap = "RdBu", transform=dataproj,extend = "both" )
# plt.colorbar (orientation = "horizontal", pad=0.01).ax.tick_params(labelsize=20)
plt.quiver (new_data.lon, new_data.lat, qx[0,12,:,:],gaussian_filter(qy[0,12,:,:],0.7), color='blue',pivot='mid',
scale=1e-11, scale_units='inches',
transform=dataproj)
# gaussian_filter(data, sigma)
plt. show ()