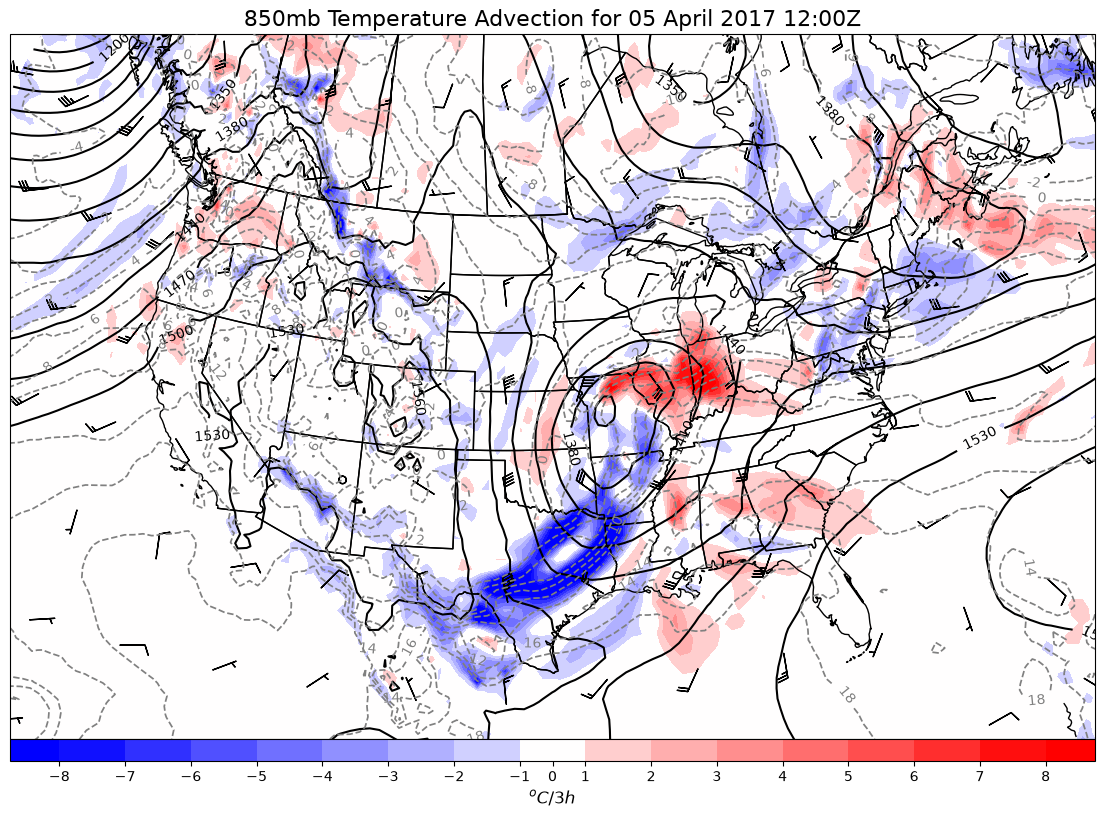
Plot an 850 hPa map with calculating advection using MetPy.
Beyond just plotting 850-hPa level data, this uses calculations from metpy.calc to find
the temperature advection. Currently, this needs an extra helper function to calculate
the distance between lat/lon grid points.
Imports
from datetime import datetime

import cartopy.crs as ccrs
import cartopy.feature as cfeature
import matplotlib.pyplot as plt
import metpy.calc as mpcalc
import numpy as np
from metpy.units import units
from siphon.catalog import TDSCatalog
from xarray.backends import NetCDF4DataStore
import xarray as xr
Create NCSS object to access the NetcdfSubset
Data from NCEI GFS 0.5 deg Analysis Archive
dt = datetime(2017, 4, 5, 12)

# Assemble our URL to the THREDDS Data Server catalog,
# and access our desired dataset within via NCSS
base_url = 'https://www.ncei.noaa.gov/thredds/catalog/model-gfs-g4-anl-files-old/'
cat = TDSCatalog(f'{base_url}{dt:%Y%m}/{dt:%Y%m%d}/catalog.xml')
ncss = cat.datasets[f'gfsanl_4_{dt:%Y%m%d}_{dt:%H}00_000.grb2'].subset()

# Create NCSS query for our desired time, region, and data variables
query = ncss.query()

query.time(dt)
query.lonlat_box(north=65, south=15, east=310, west=220)
query.accept('netcdf')
query.variables('Geopotential_height_isobaric',
                'Temperature_isobaric',
                'u-component_of_wind_isobaric',
                'v-component_of_wind_isobaric')

# Obtain the queried data
data = ncss.get_data(query)

# Make into an xarray Dataset object
ds = xr.open_dataset(NetCDF4DataStore(data)).metpy.parse_cf()

# Pull out variables you want to use
level = 850 * units.hPa
hght_850 = ds.Geopotential_height_isobaric.metpy.sel(
    vertical=level).squeeze()
temp_850 = ds.Temperature_isobaric.metpy.sel(
    vertical=level).squeeze()
u_wind_850 = ds['u-component_of_wind_isobaric'].metpy.sel(
    vertical=level).squeeze()
v_wind_850 = ds['v-component_of_wind_isobaric'].metpy.sel(
    vertical=level).squeeze()
time = hght_850.metpy.time
lat = ds.latitude.values
lon = ds.longitude.values

# Convert number of hours since the reference time into an actual date
vtime = time.values.astype('datetime64[ms]').astype('O')

# Combine 1D latitude and longitudes into a 2D grid of locations
lon_2d, lat_2d = np.meshgrid(lon, lat)
Begin data calculations
# Calculate temperature advection using metpy function
adv = mpcalc.advection(temp_850, u_wind_850, v_wind_850)

# Smooth heights and advection a little
# Be sure to only put in a 2D lat/lon or Y/X array for smoothing
Z_850 = mpcalc.smooth_gaussian(hght_850, 2)
adv = mpcalc.smooth_gaussian(adv, 2)
/tmp/ipykernel_4026/72829660.py:2: UserWarning: Vertical dimension number not found. Defaulting to (..., Z, Y, X) order.
adv = mpcalc.advection(temp_850, u_wind_850, v_wind_850)
Begin map creation
# Set Projection of Data
datacrs = ccrs.PlateCarree()

# Set Projection of Plot
plotcrs = ccrs.LambertConformal(central_latitude=45,
                                central_longitude=-100, standard_parallels=[30, 60])

# Create new figure
fig = plt.figure(figsize=(14, 12))

# Add the map and set the extent
ax = plt.subplot(111, projection=plotcrs)
plt.title(f'850mb Temperature Advection for {vtime:%d %B %Y %H:%MZ}',
          fontsize=16)
ax.set_extent([235., 290., 20., 55.])

# Add state/country boundaries to plot
ax.add_feature(cfeature.STATES)
ax.add_feature(cfeature.BORDERS)

# Plot Height Contours
clev850 = np.arange(900, 3000, 30)
cs = ax.contour(lon_2d, lat_2d, Z_850, clev850, colors='black', linewidths=1.5,
                linestyles='solid', transform=datacrs)
plt.clabel(cs, fontsize=10, inline=1, inline_spacing=10, fmt='%i',
           rightside_up=True, use_clabeltext=True)

# Plot Temperature Contours
clevtemp850 = np.arange(-20, 20, 2)
cs2 = ax.contour(lon_2d, lat_2d, temp_850.metpy.convert_units('degC'),
                 clevtemp850, colors='grey', linewidths=1.25,
                 linestyles='dashed', transform=datacrs)
plt.clabel(cs2, fontsize=10, inline=1, inline_spacing=10, fmt='%i',
           rightside_up=True, use_clabeltext=True)

# Plot Colorfill of Temperature Advection
cint = np.arange(-8, 9)
cf = ax.contourf(lon_2d, lat_2d, 3*adv.metpy.convert_units('delta_degC/hour'),
                 cint[cint != 0],
                 extend='both', cmap='bwr', transform=datacrs)
cb = plt.colorbar(cf, orientation='horizontal', pad=0, aspect=50,
                  extendrect=True, ticks=cint)
cb.set_label(r'$^{o}C/3h$', size='large')

wind_slice = (slice(None, None, 10), slice(None, None, 10))
# Plot Wind Barbs
ax.barbs(lon_2d[wind_slice], lat_2d[wind_slice],
         u_wind_850.metpy.convert_units('kt').values[wind_slice],
         v_wind_850.metpy.convert_units('kt').values[wind_slice],
         length=6, pivot='middle', transform=datacrs);
/home/runner/micromamba/envs/metpy-cookbook/lib/python3.14/site-packages/cartopy/io/__init__.py:263: DownloadWarning: Downloading: https://naturalearth.s3.amazonaws.com/50m_cultural/ne_50m_admin_0_boundary_lines_land.zip
warnings.warn(f'Downloading: {url}', DownloadWarning)